Magic Stat Simple. Fast. Nice. Magic.
✦  The ultimate statistical suite for macOS, Windows & Linux

From your spreadsheet to a publishable figure in seconds

Magic Stat turns data into science. Go from exploratory analysis to structural equation modeling (SEM/PLS), with figures and tables already in scientific format — and a built-in AI that reads, interprets and comments every result.

✓ For macOS, Windows & Linux ✓ No command line ✓ Publication-quality output ✓ Built-in AI assistants
AI‑empowered

chat Magic Stat Assistant

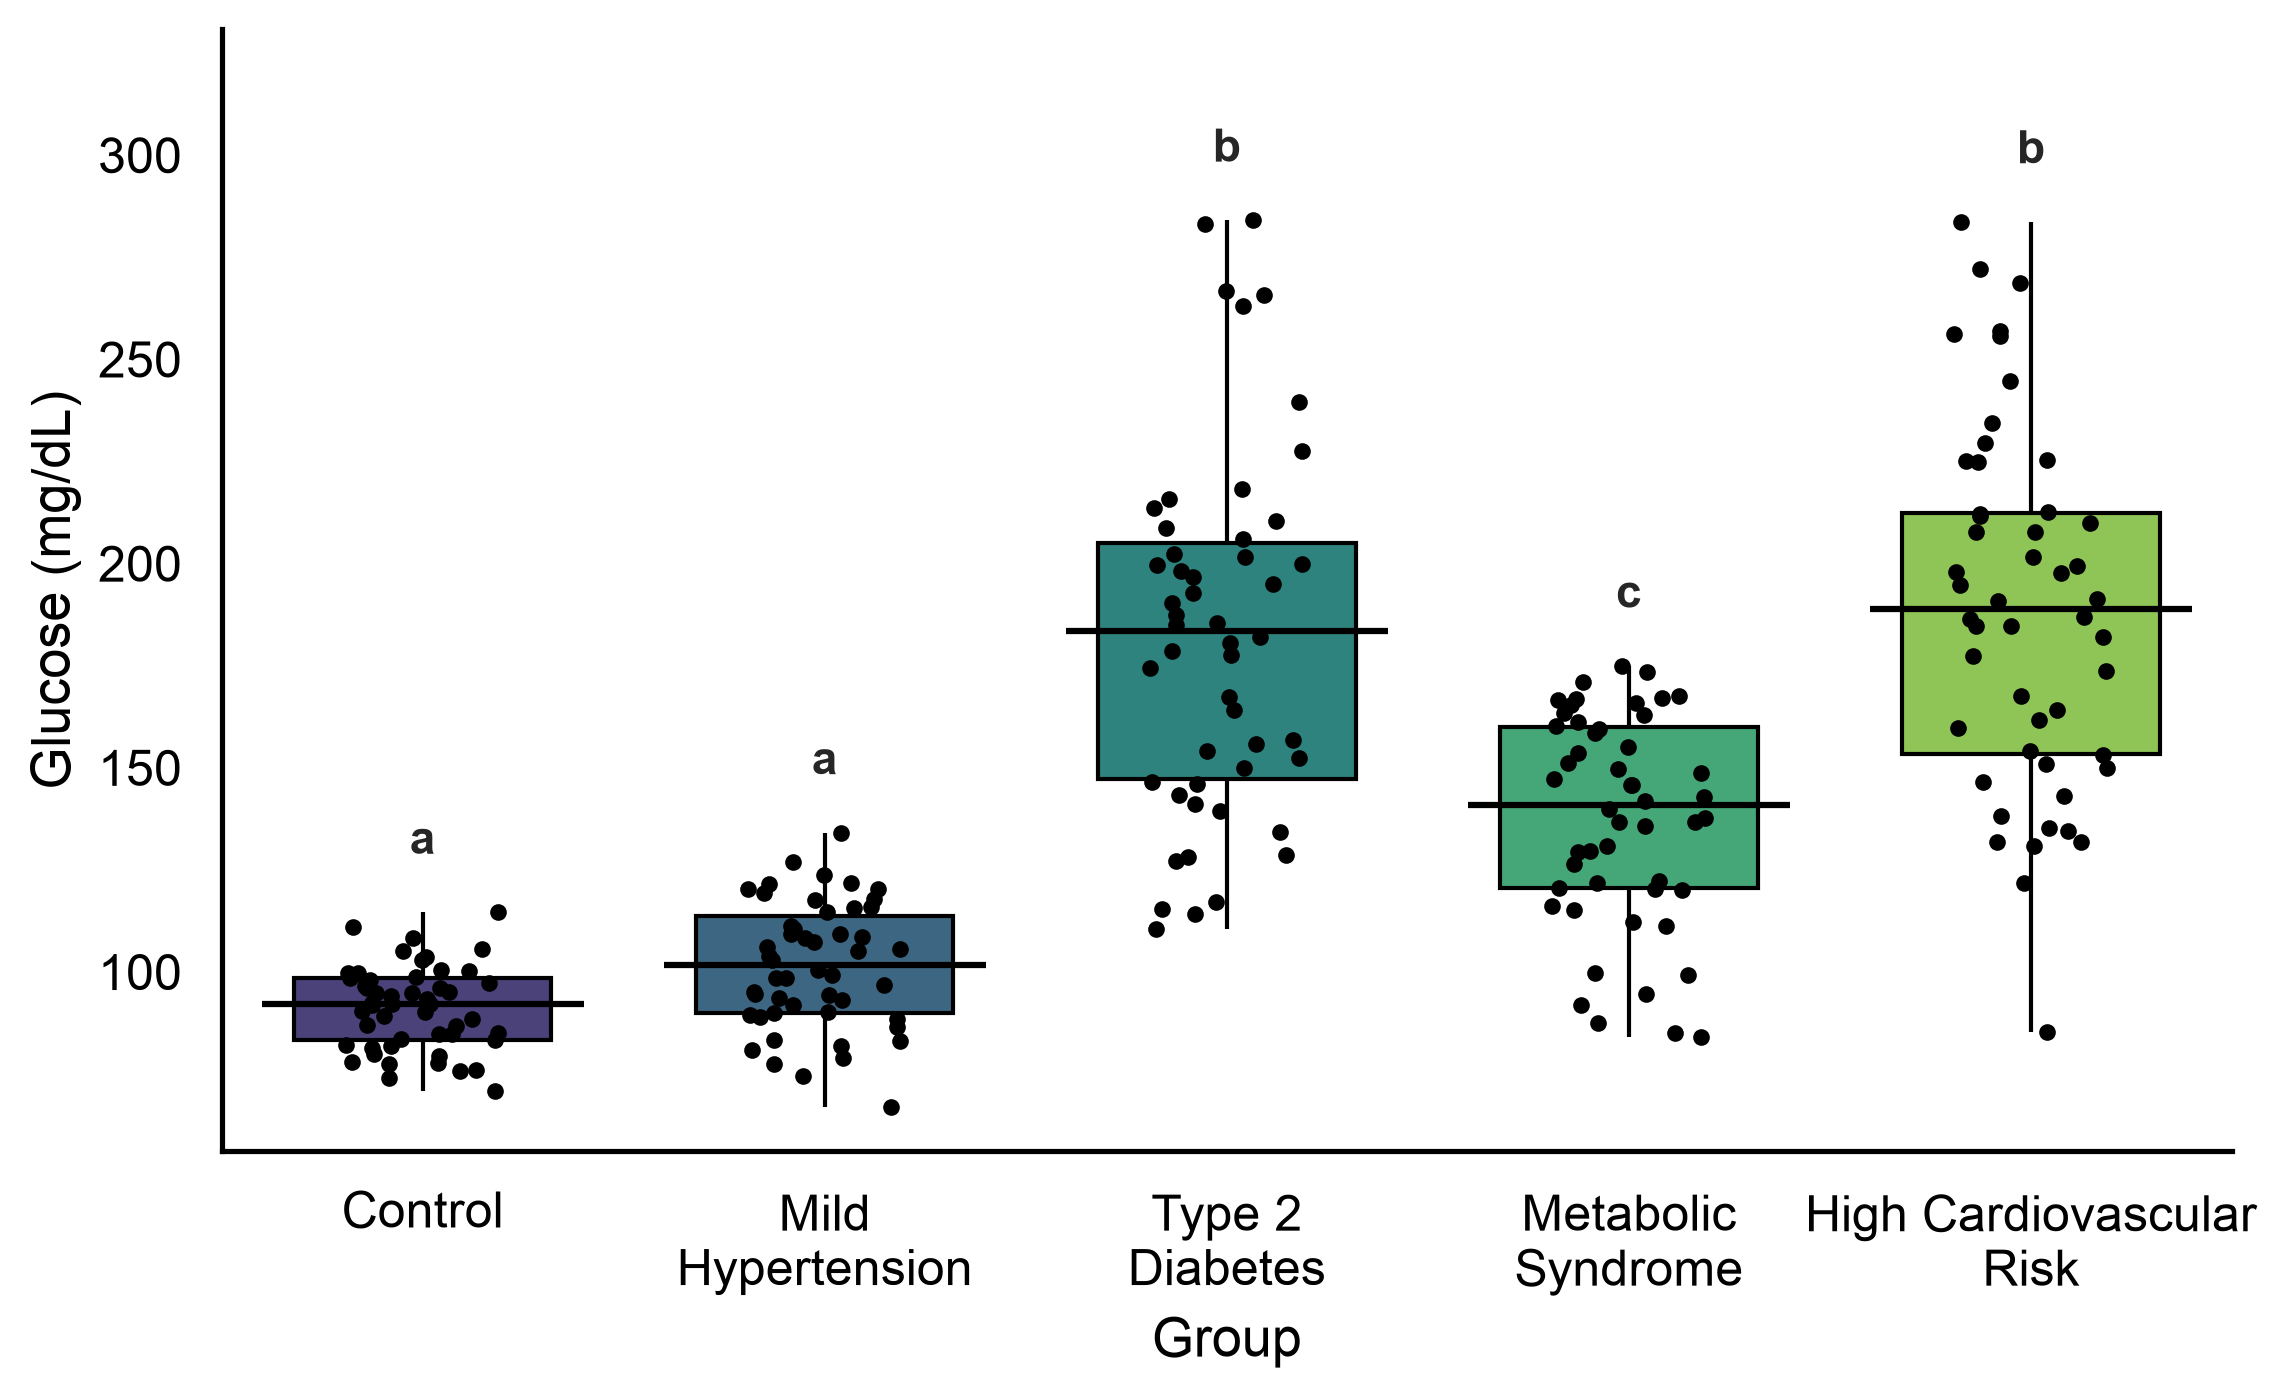
Box plot

chat Magic Stat Assistant

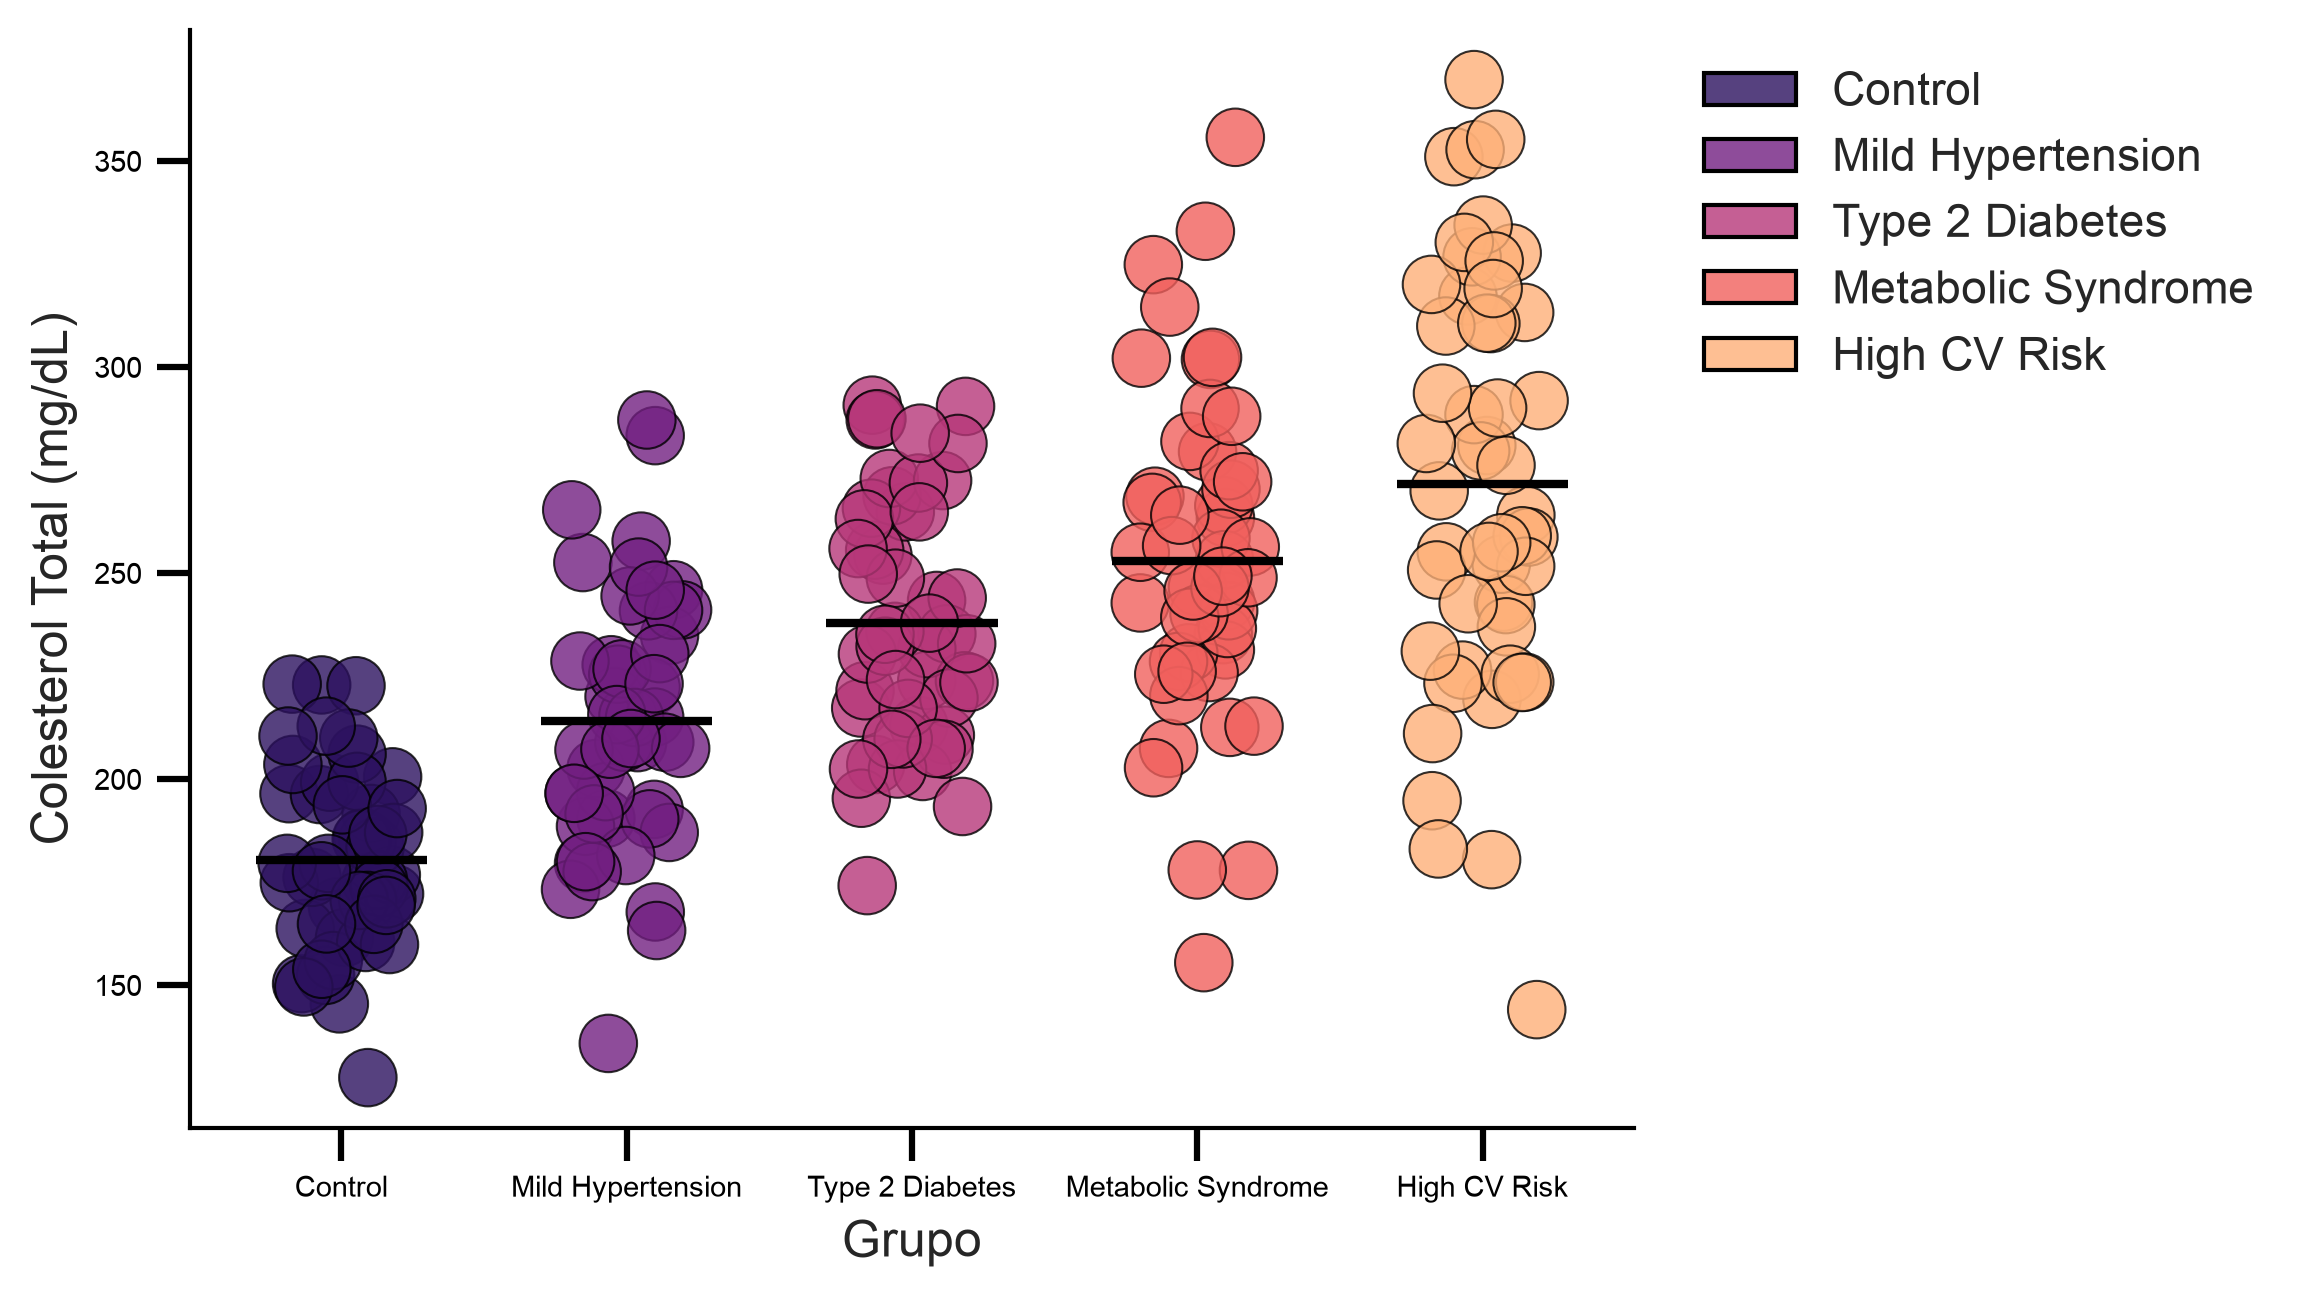
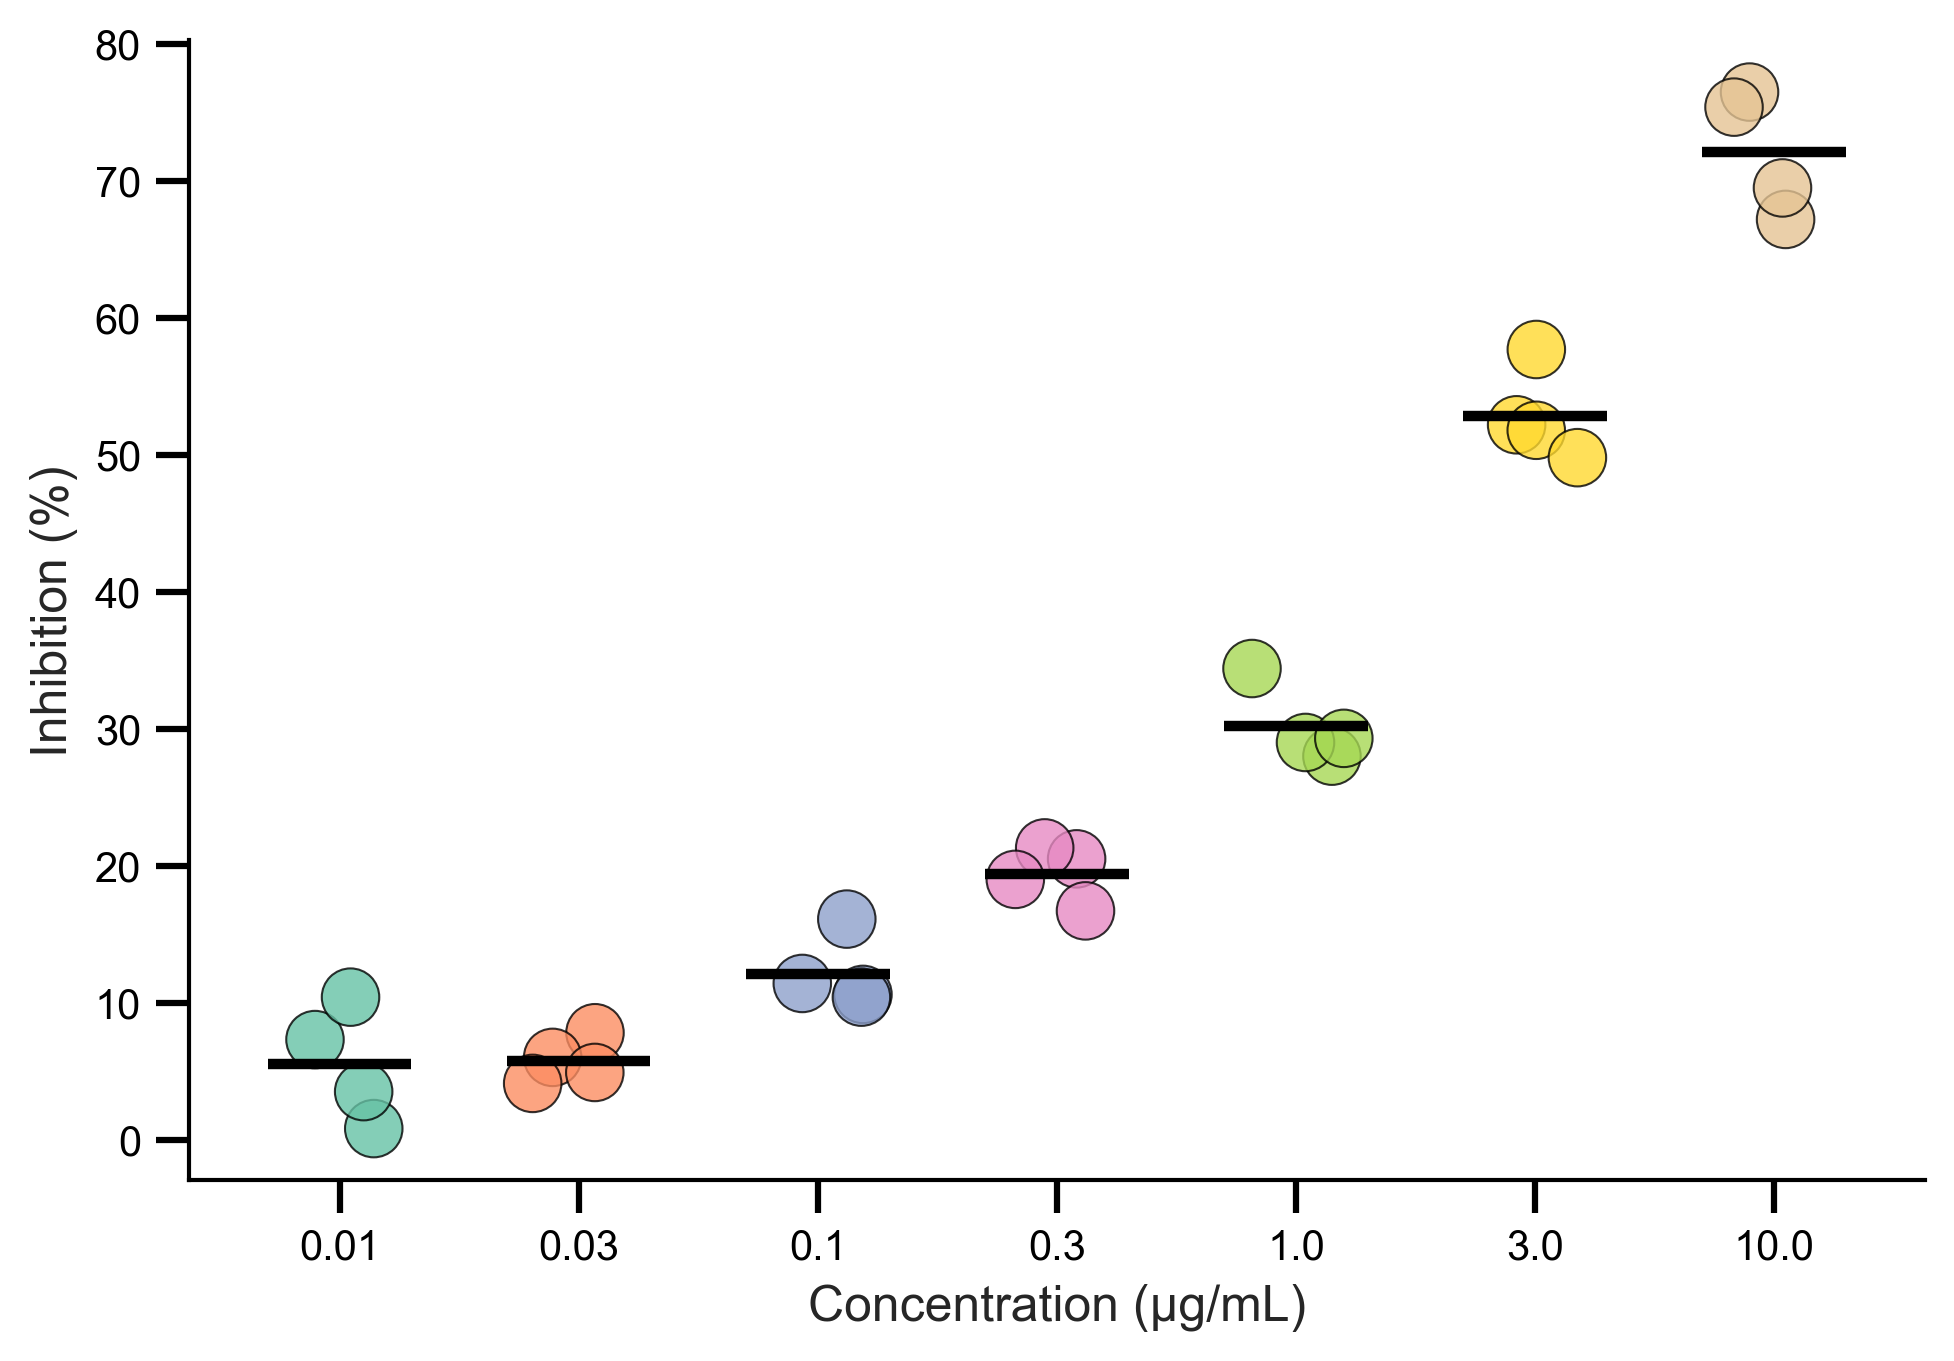
Dot plot

chat Magic Stat Assistant

Dot plot

Your data, your words — Magic Stat does the work.

0+ features
0statistical domains
0% editorial quality
0click to have AI explain
What it does

A statistical arsenal, with the simplicity of an app

From descriptive statistics to advanced structural modeling — all in one place, no plugins, with the rigorous output your paper demands.

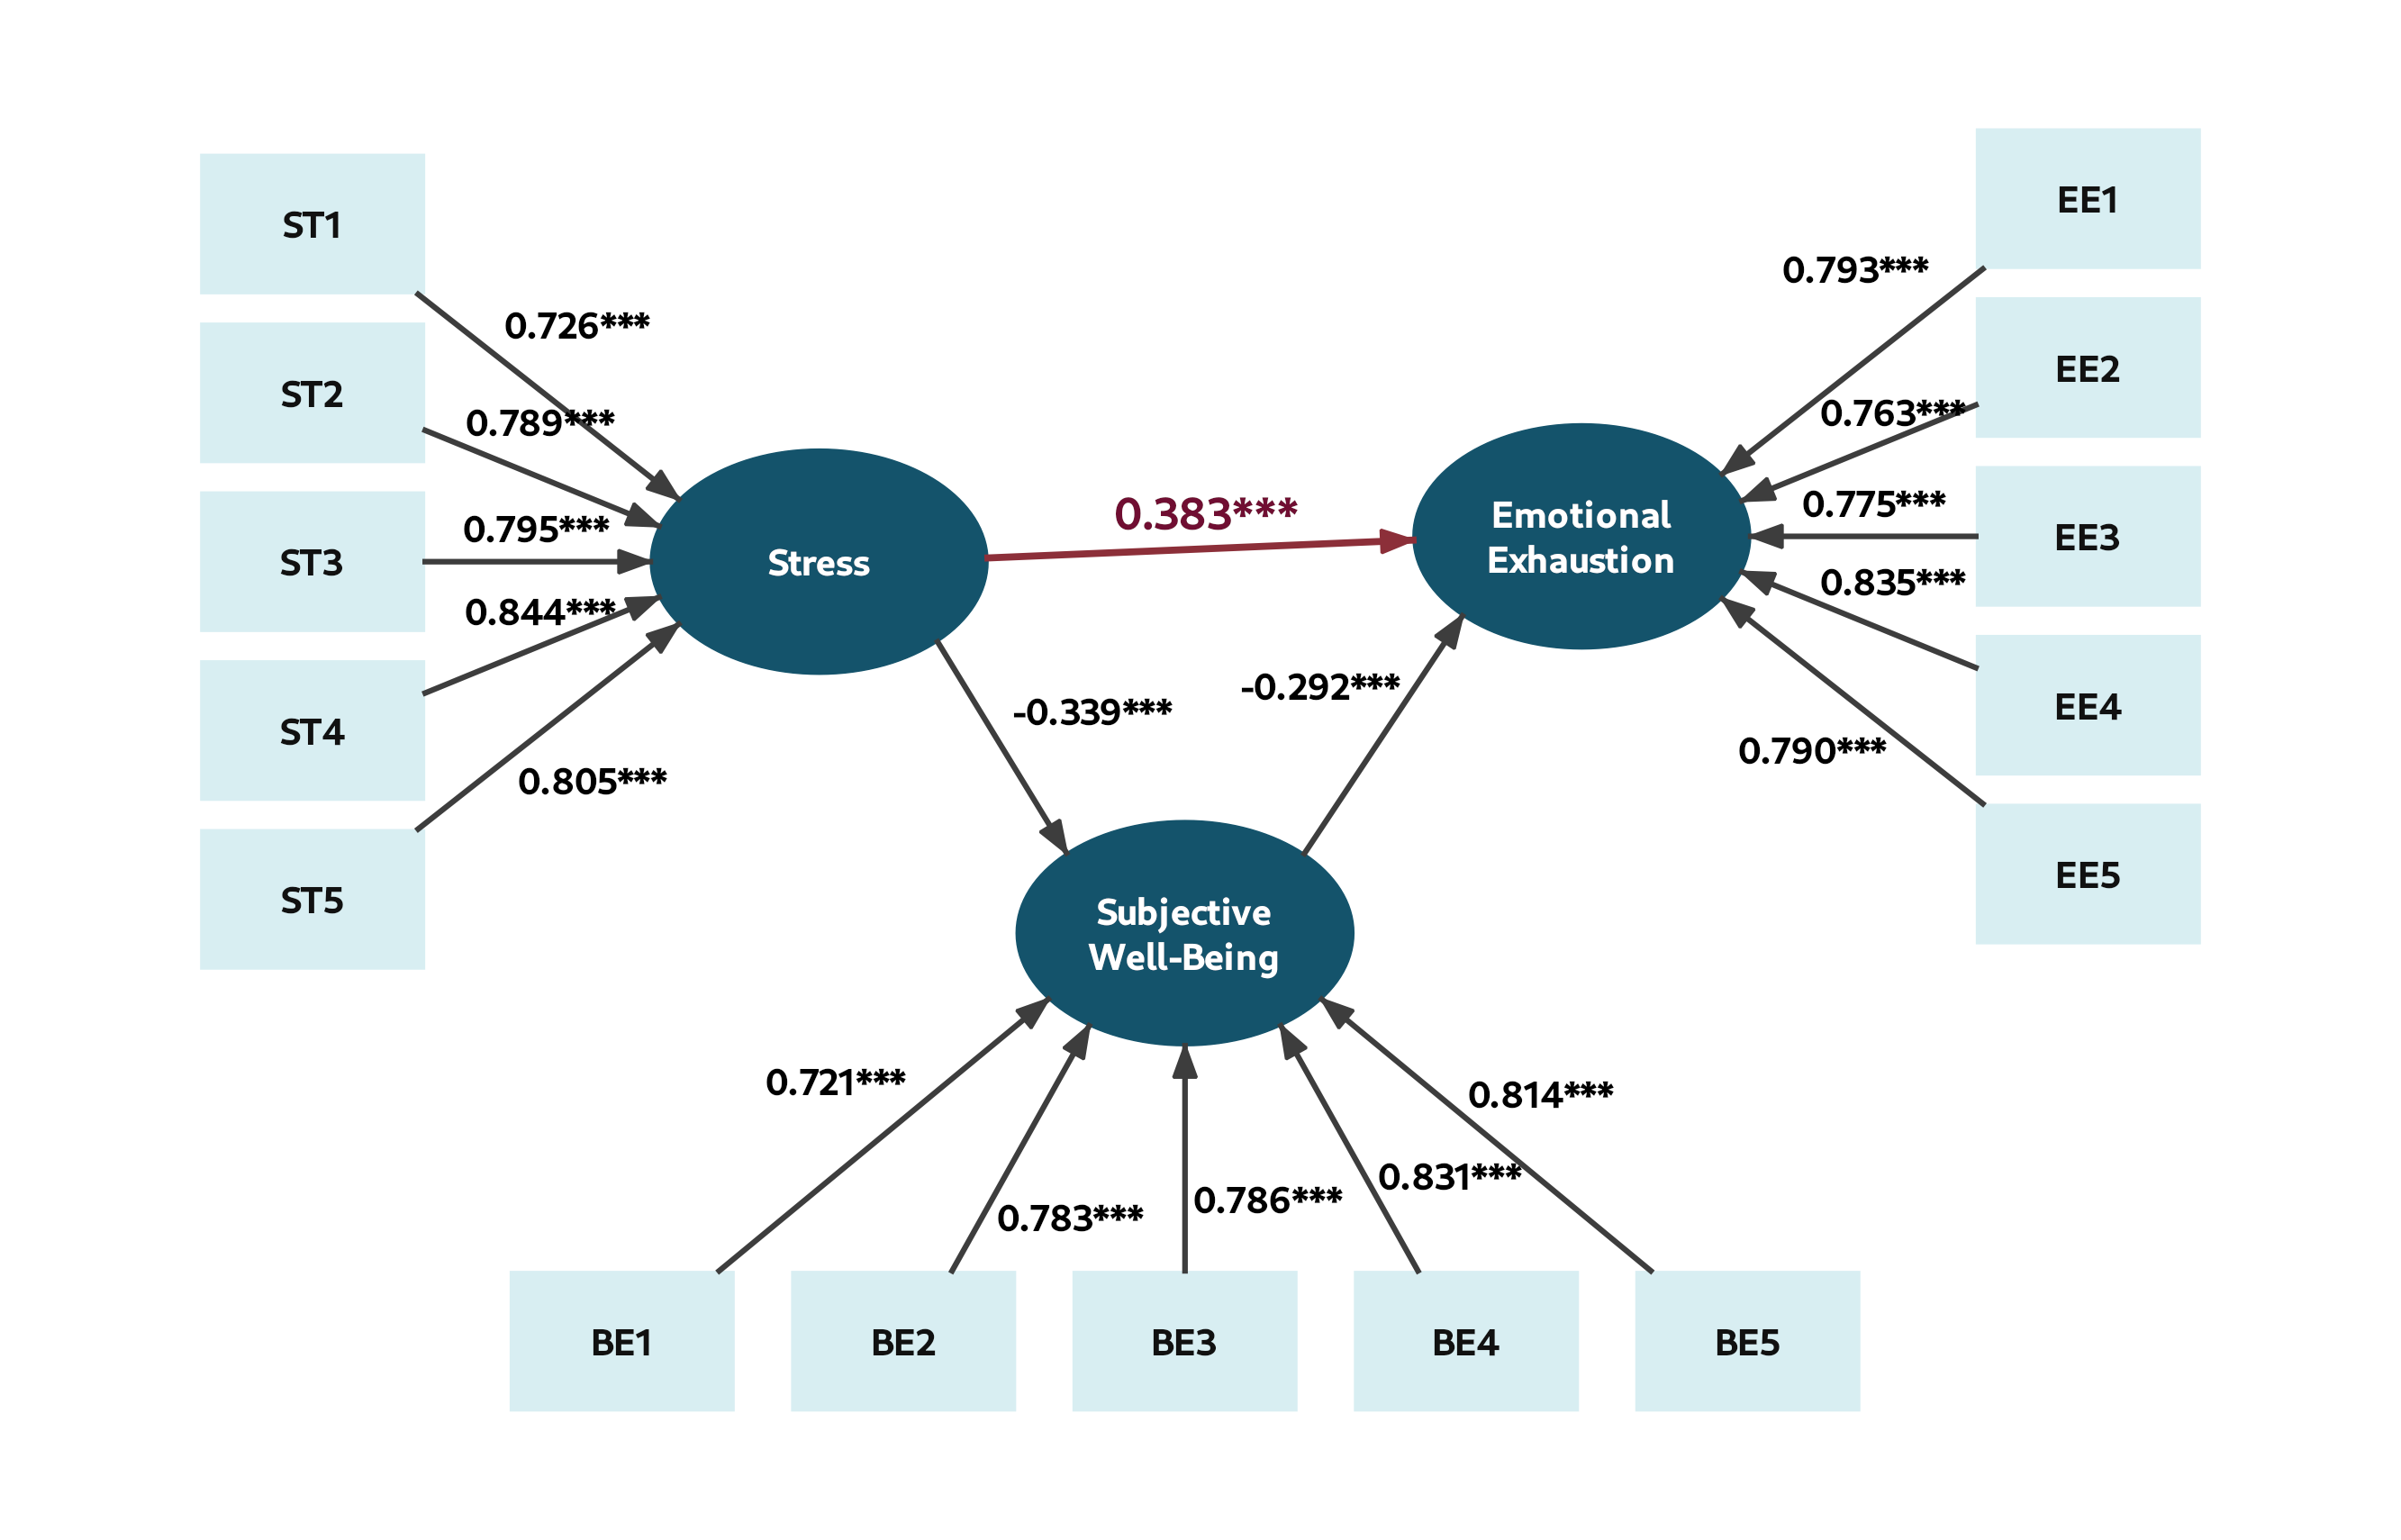
SEM & PLS

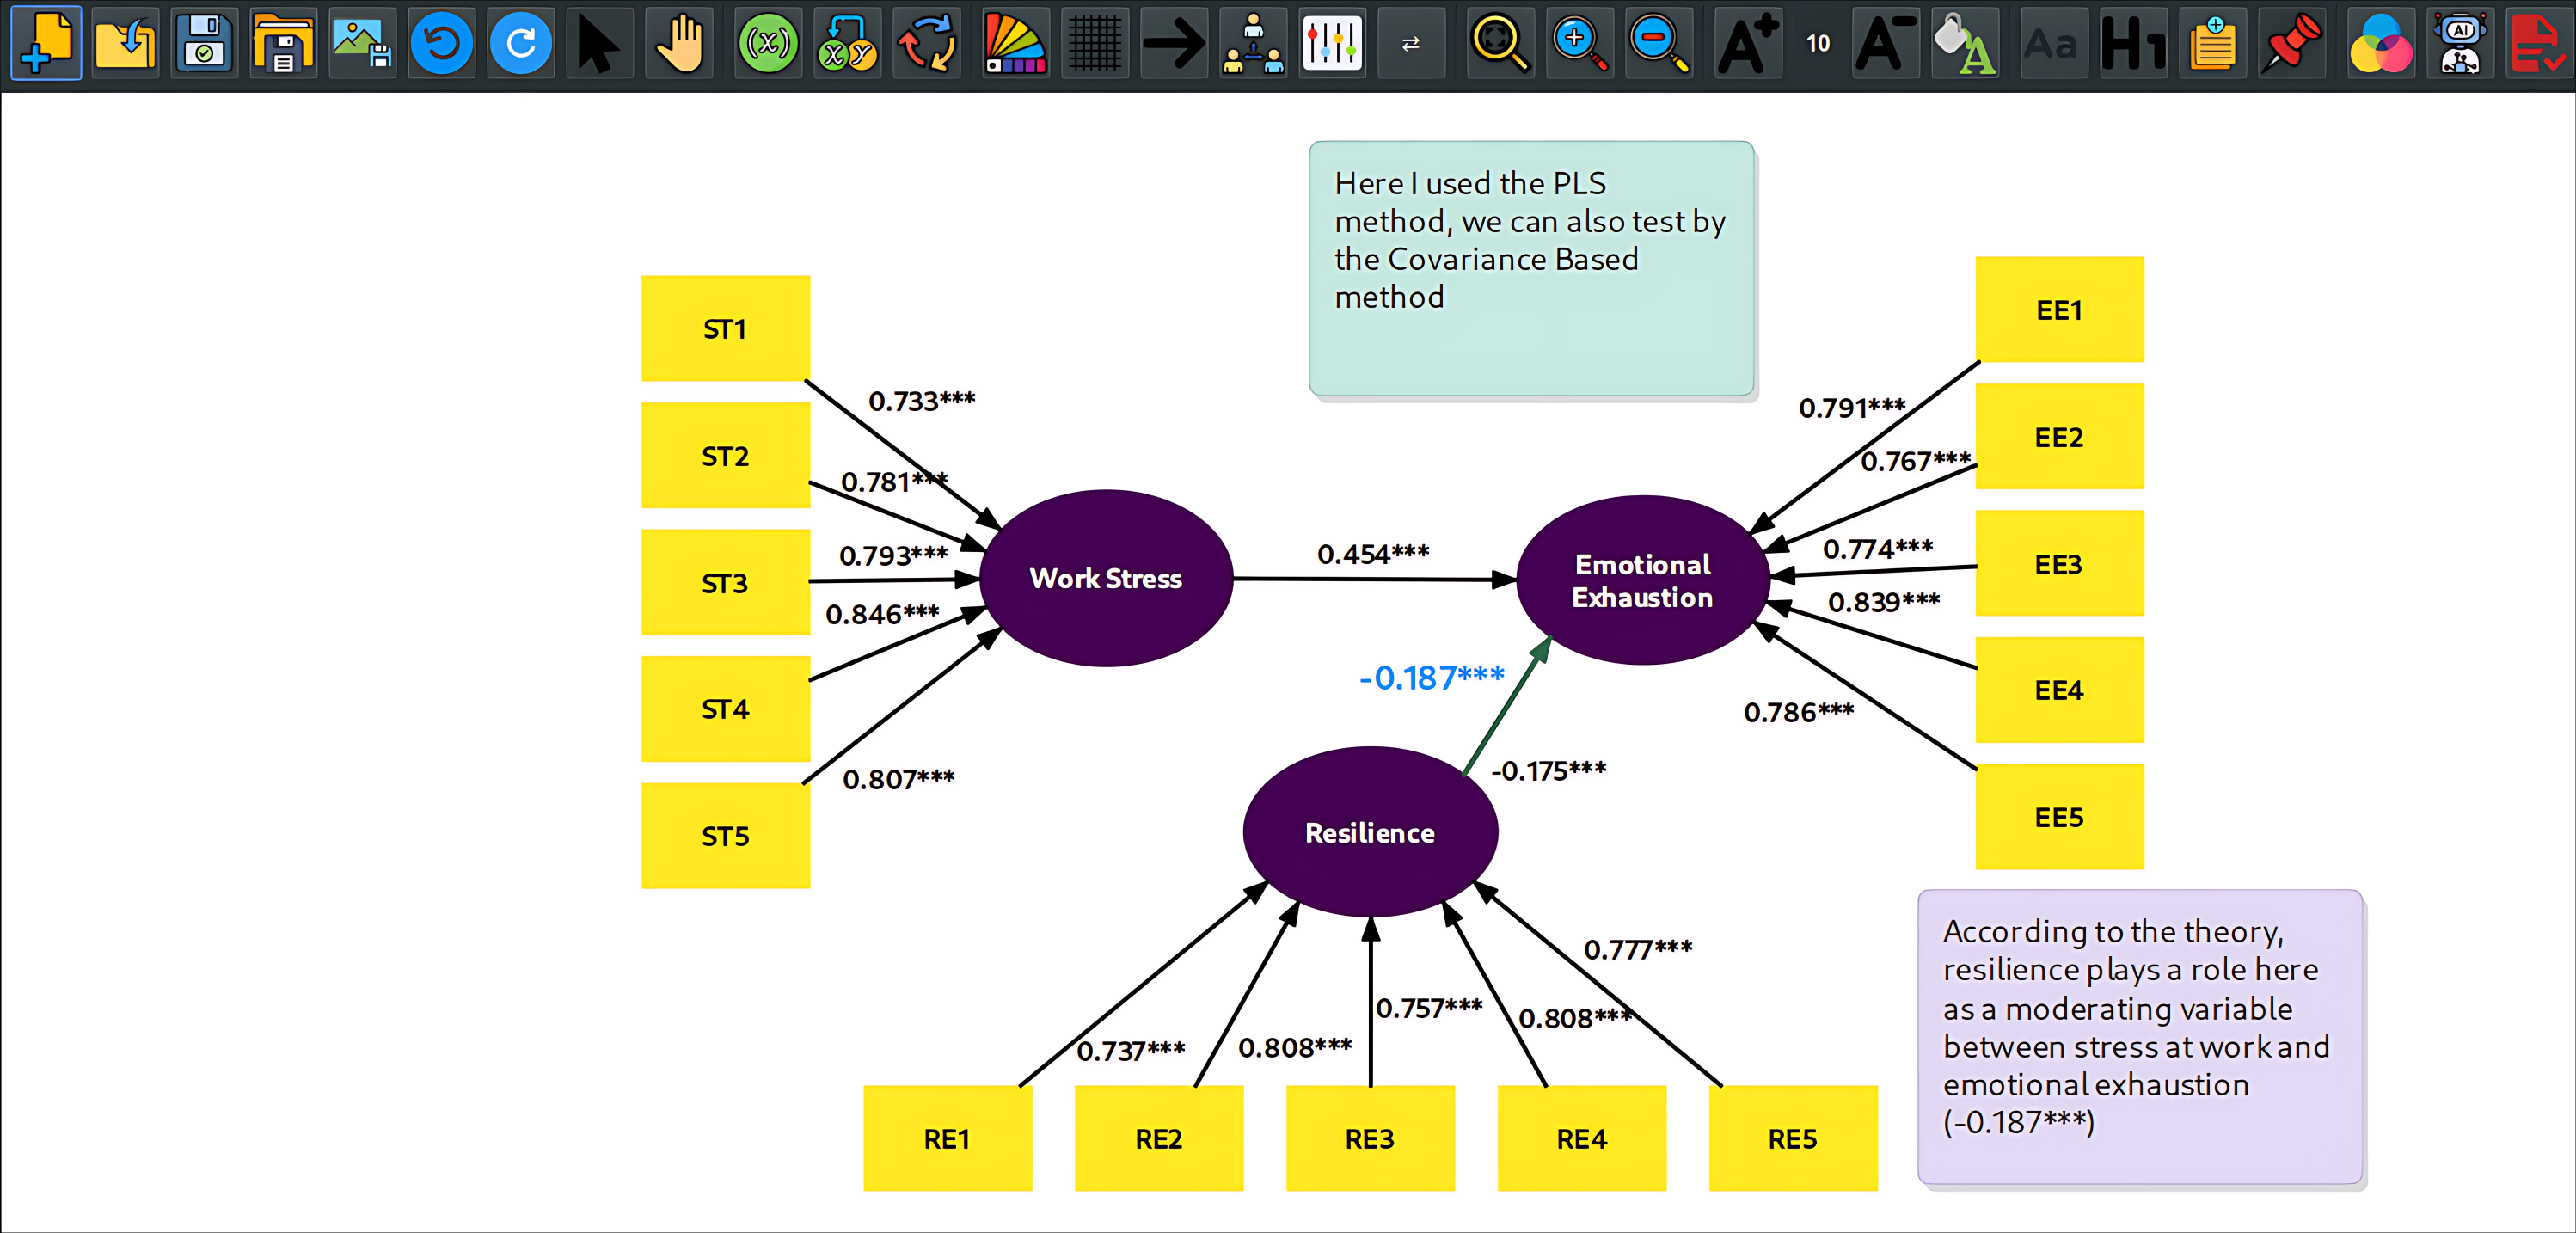
Structural equation modeling and PLS-SEM with a drag-and-drop interface, plus covariance-based path analysis.

  • Editable path diagrams
  • Reliability, validity & HTMT
  • Indirect effects & bootstrapping

Psychometrics

Reliability and construct-validity analysis for psychology and the social sciences.

  • Cronbach's alpha & Omega
  • Factor analysis (EFA)
  • KMO, Bartlett & item-total

Ecology

Biodiversity and community ecology with the canonical metrics.

  • Alpha and beta diversity
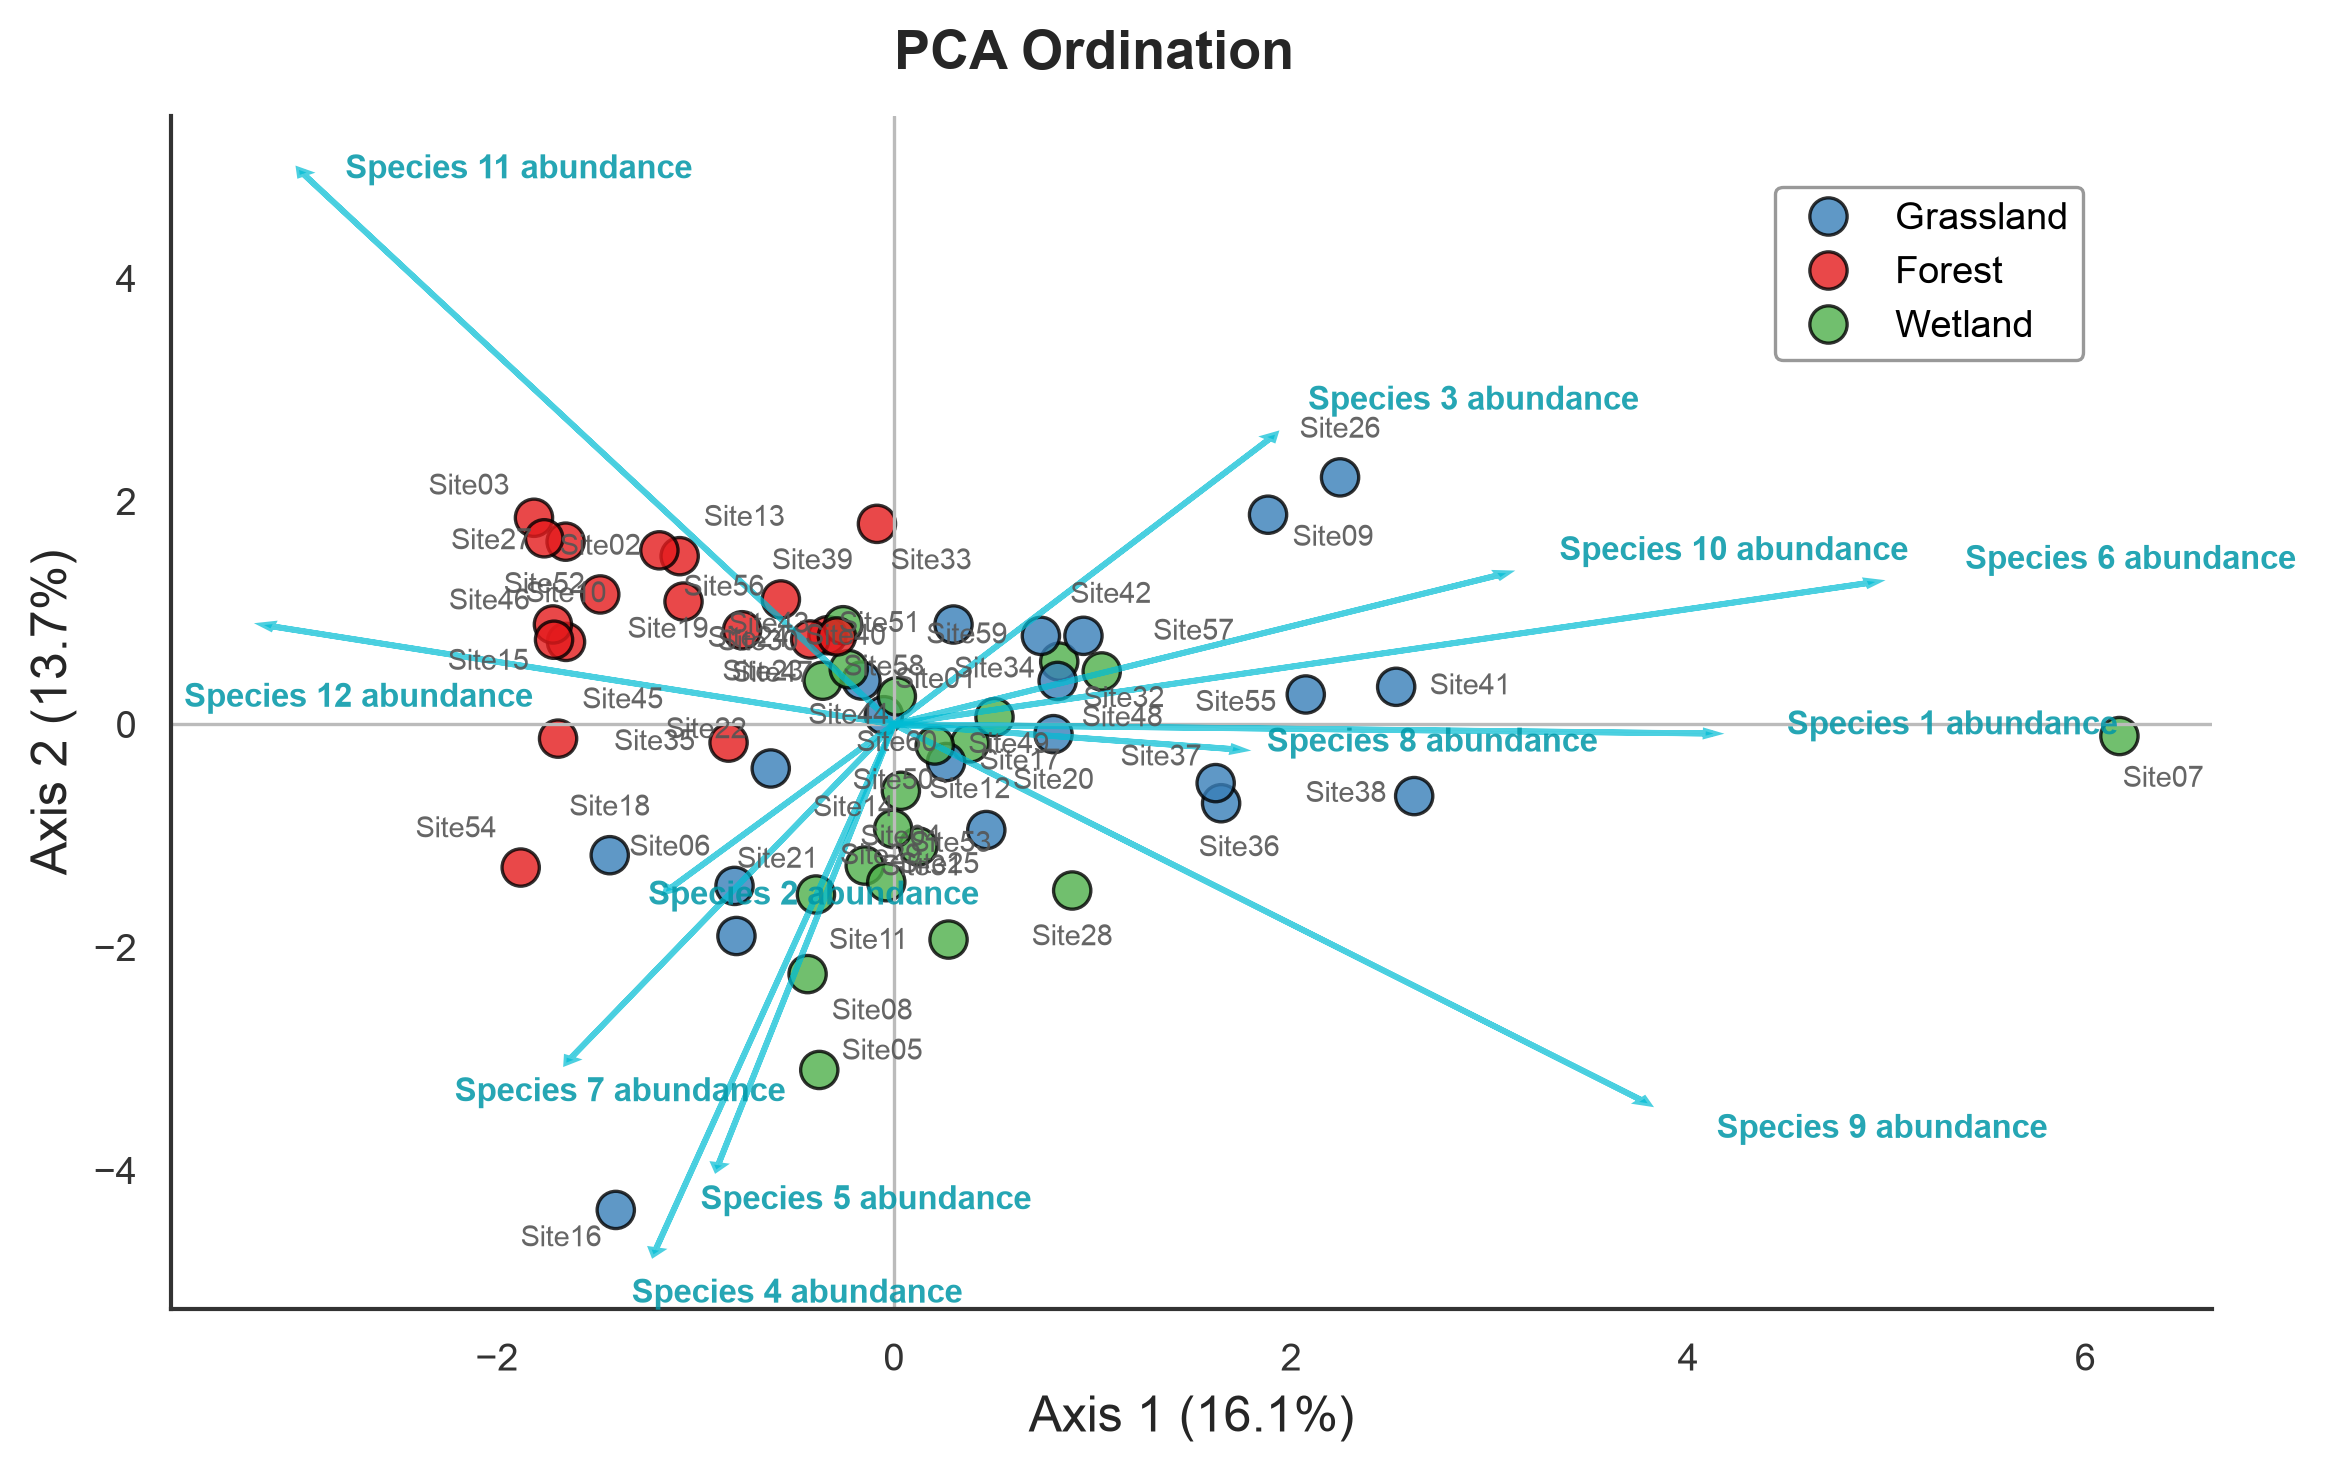
  • Ordination analysis
  • Functional & phylogenetic diversity

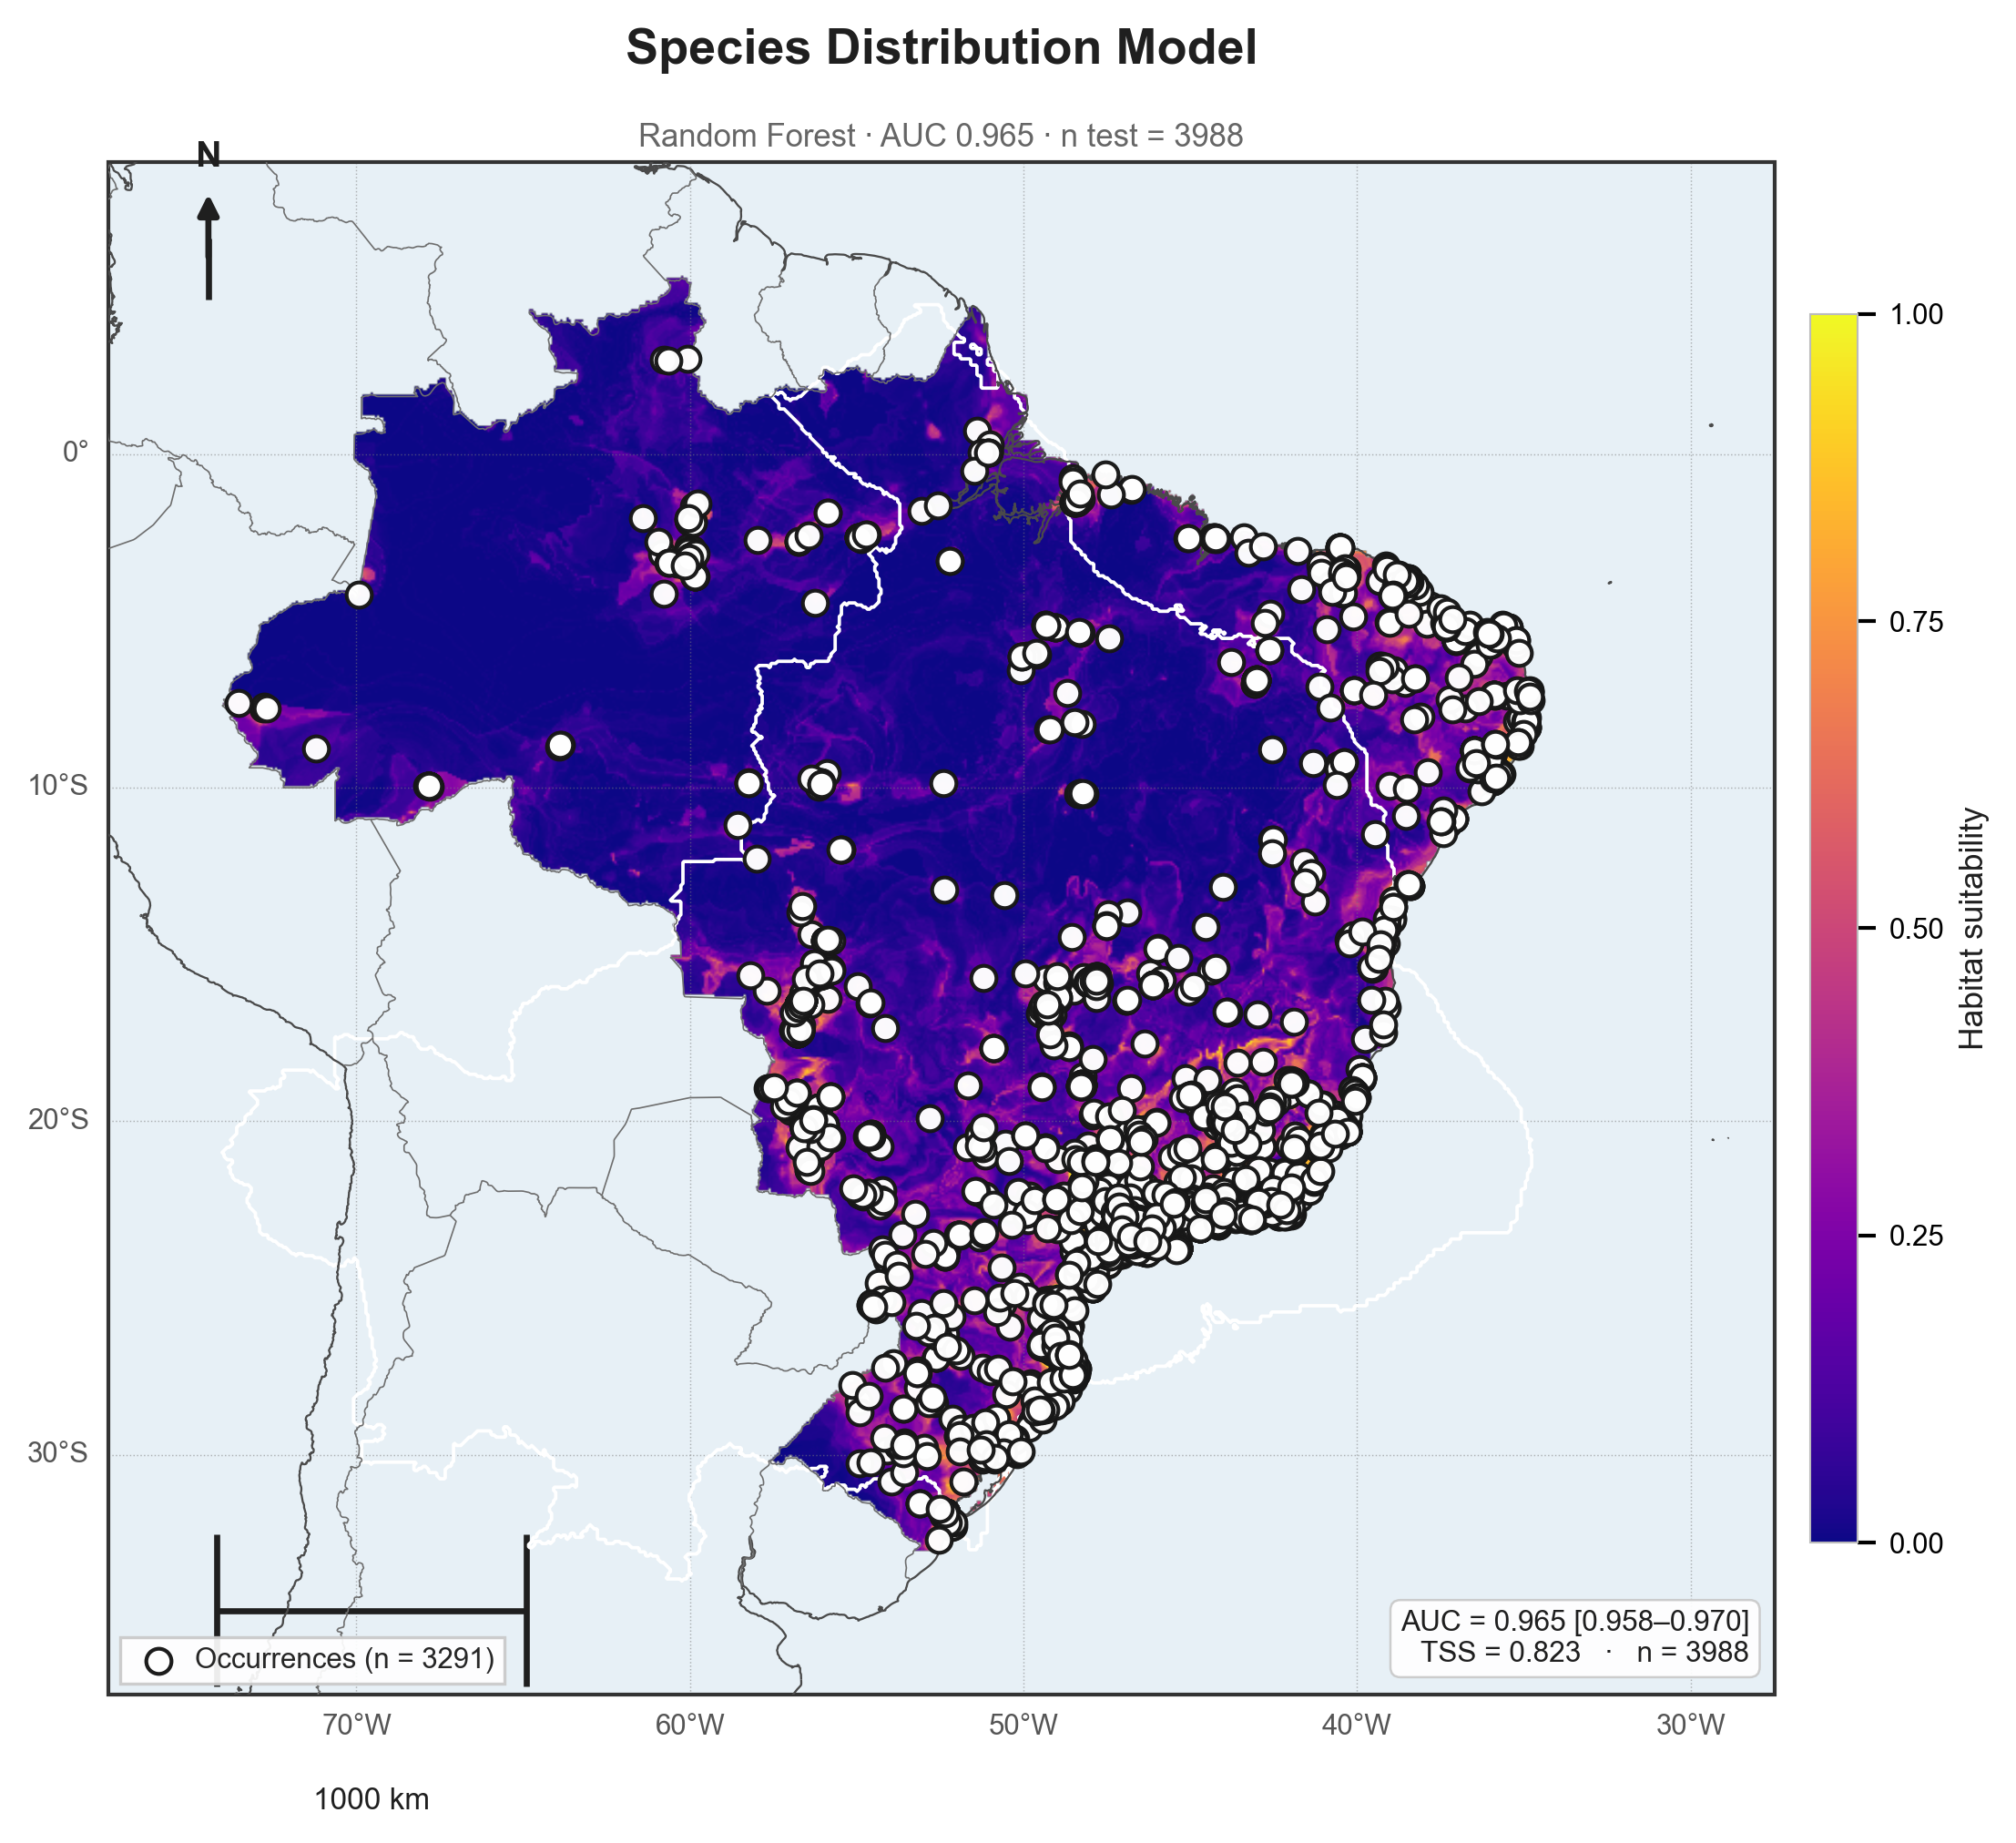
Species distribution modeling

From occurrence points to habitat-suitability maps in a few clicks.

  • Occurrence points + environmental rasters
  • Model ensemble with automatic evaluation
  • High-resolution suitability maps

Time series

Forecasting and decomposition for data over time.

  • Holt-Winters, Theta, ARIMA
  • STL decomposition
  • ACF/PACF & stationarity tests

Dynamical systems & chaos

Type equations on screen and explore chaos — from ODEs to discrete maps and reaction–diffusion systems.

  • Bifurcation diagrams & phase portraits
  • Lyapunov spectrum, Poincaré & basins of attraction
  • Chaos detection in real time series

Mixed models

Fixed and random effects for clustered and repeated-measures data.

  • Random intercepts
  • Repeated-measures ANOVA
  • Mixed designs

Generalized & nonlinear models

Advanced regression families for counts, categories and curved relationships.

  • Poisson & multinomial logistic
  • GAM, GEE & GLM
  • Nonlinear (nls) & robust (Theil–Sen)

Medical statistics

Tools built for clinical and diagnostic research.

  • ROC curves & AUC (DeLong)
  • Bland-Altman & Kaplan-Meier
  • Cohen's Kappa & diagnostic tests

Econometrics

The applied-econometrics toolbox for impact, panel and volatility studies.

  • Panel data, differences-in-differences & structural breaks
  • 2SLS, SUR & GARCH family
  • Granger causality & cointegration

Multivariate

Dimensionality reduction and ordination for any field.

  • PCA, PCoA, NMDS
  • CA, DCA, RDA, CCA
  • PERMANOVA & MANOVA
  • Cluster analysis & discriminant (LDA)

Spatial analysis

Autocorrelation, clusters and regression for georeferenced data.

  • Moran's I, LISA & correlograms
  • Variograms & interpolation maps
  • GWR & spatial regression (SAR/CAR)

Meta-analysis

Combine and quantify evidence across multiple studies.

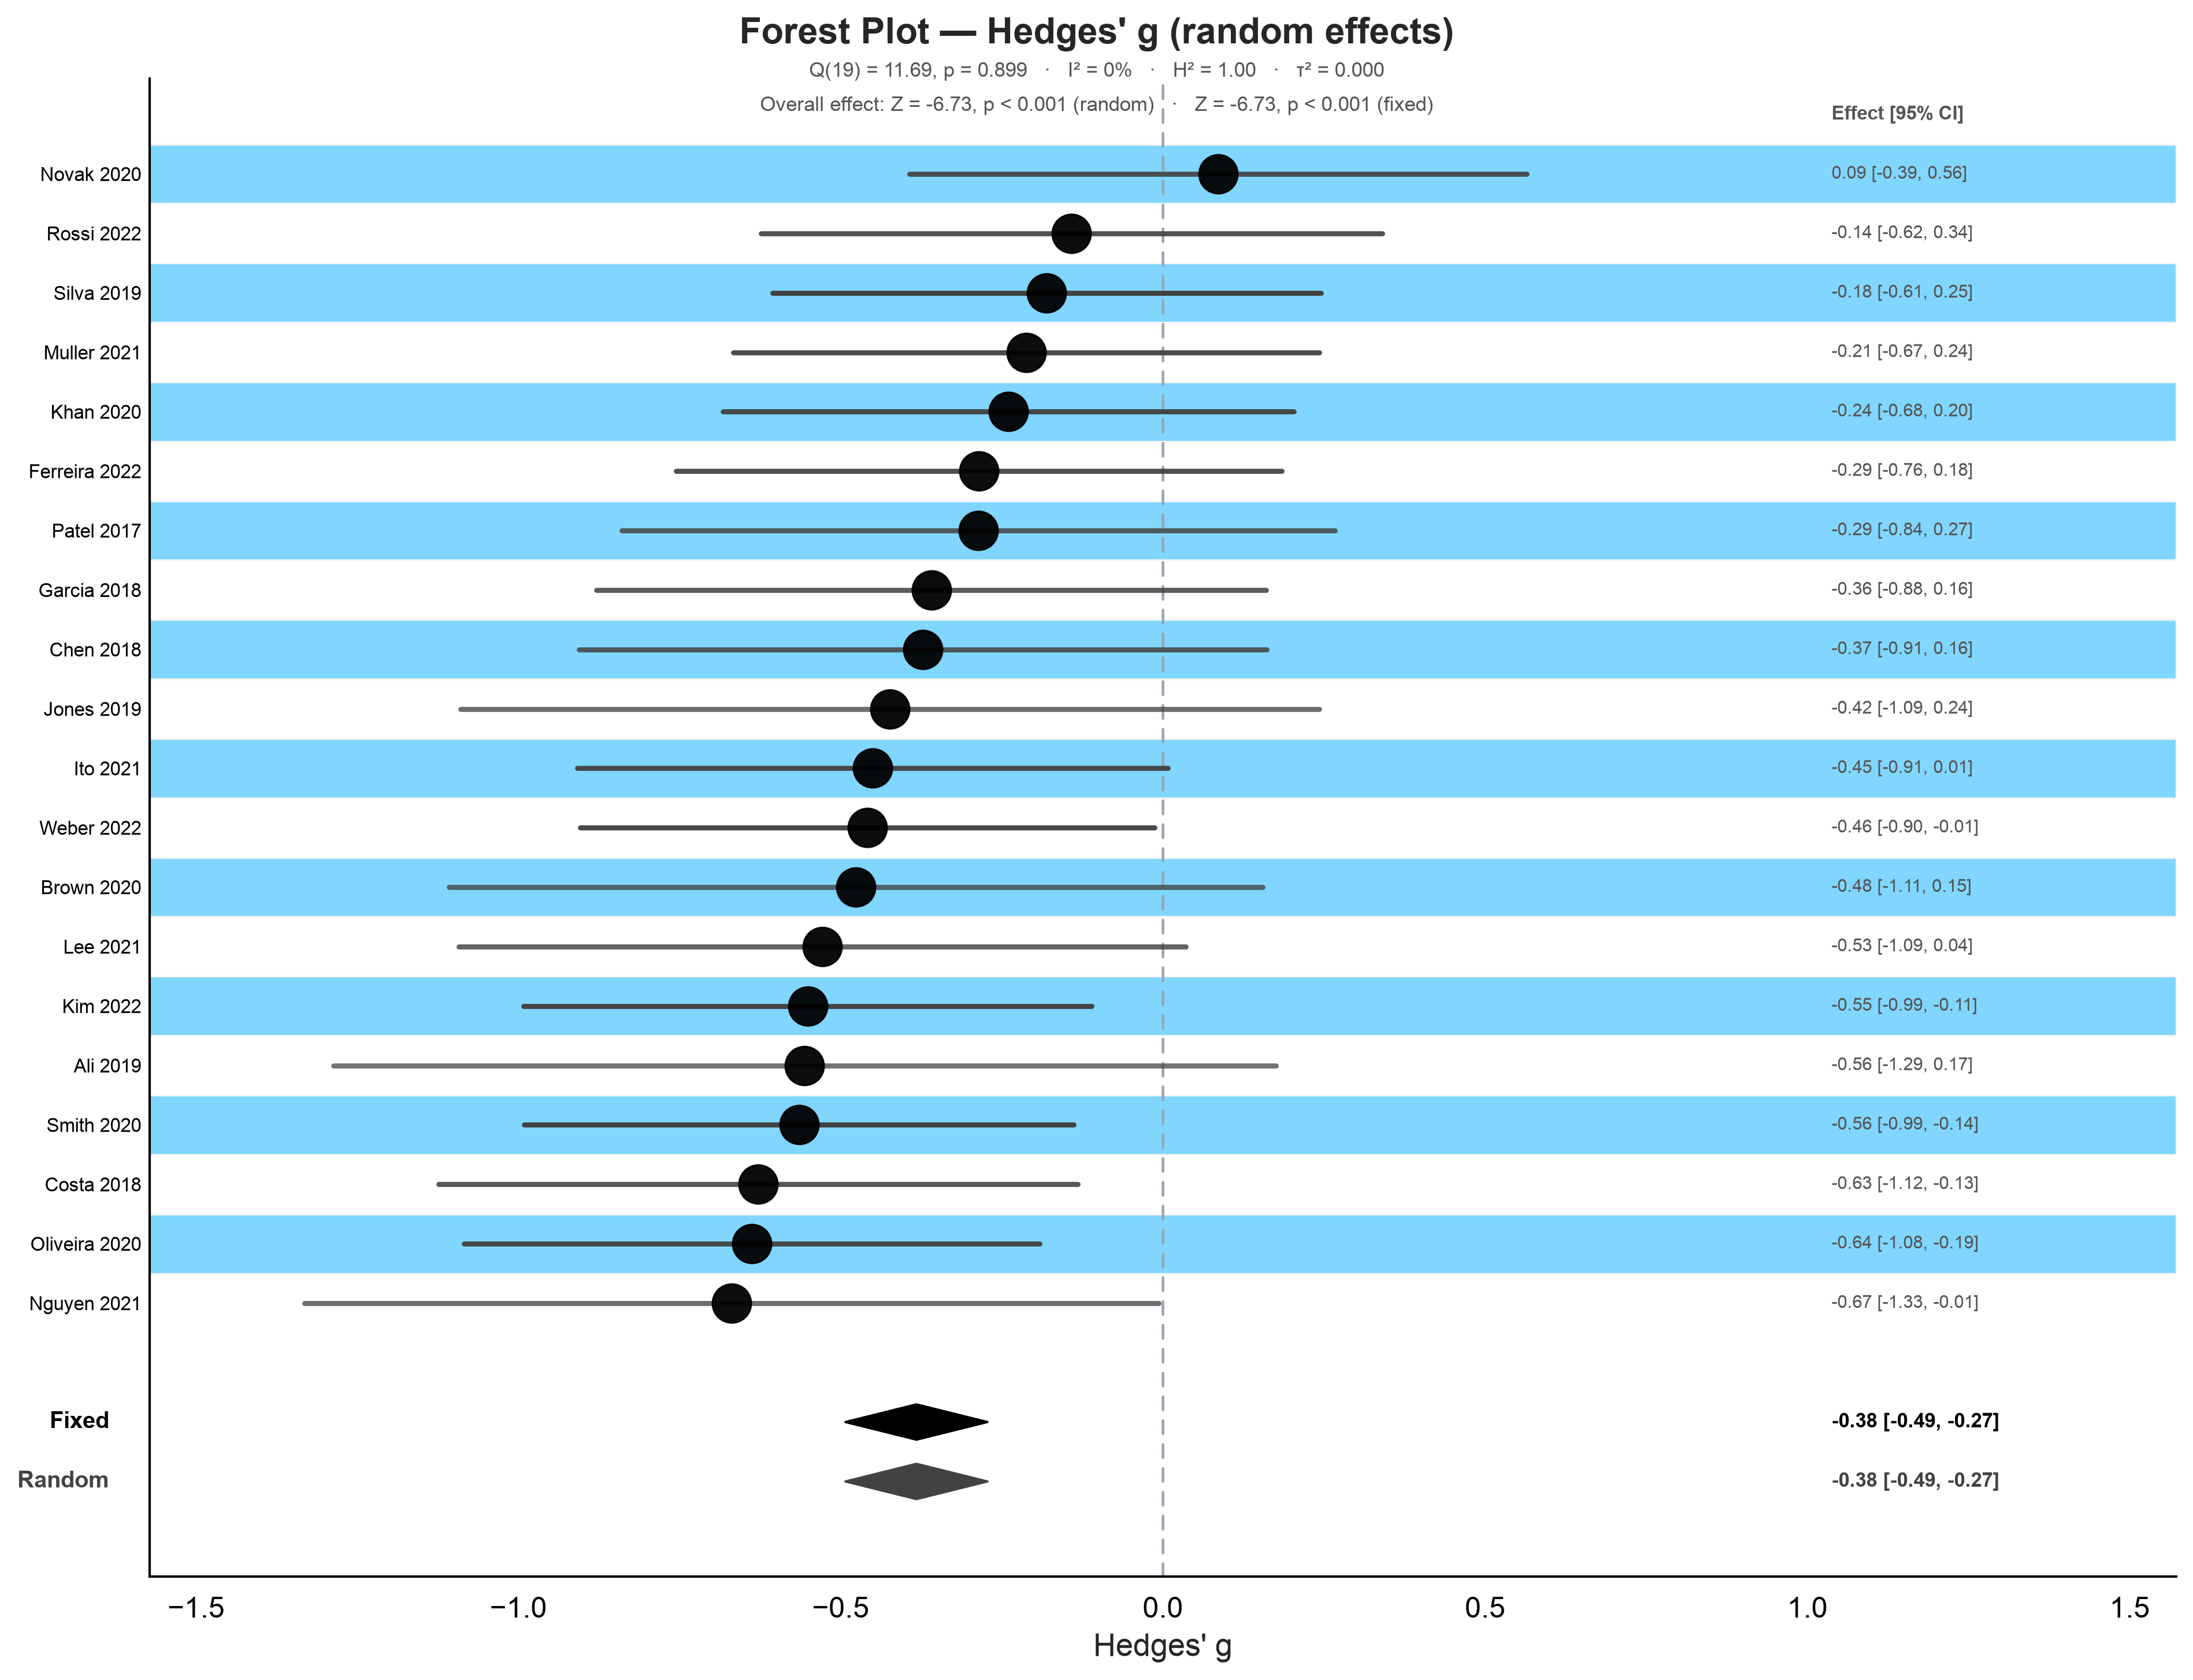
  • Forest & funnel plots
  • Heterogeneity (I², τ²)
  • Egger's test & sensitivity

Power analysis

Plan your study with the ideal sample size.

  • t, ANOVA, correlation, chi-square
  • Regression & SEM
  • Power curves & sample-size tables

Bayesian statistics

Inference with Bayes factors and credible intervals.

  • JZS BF for t, ANOVA, correlation & regression
  • HDI / ROPE
  • Posteriors

Regression & correlation

From simple to flexible.

  • Simple, multiple, polynomial
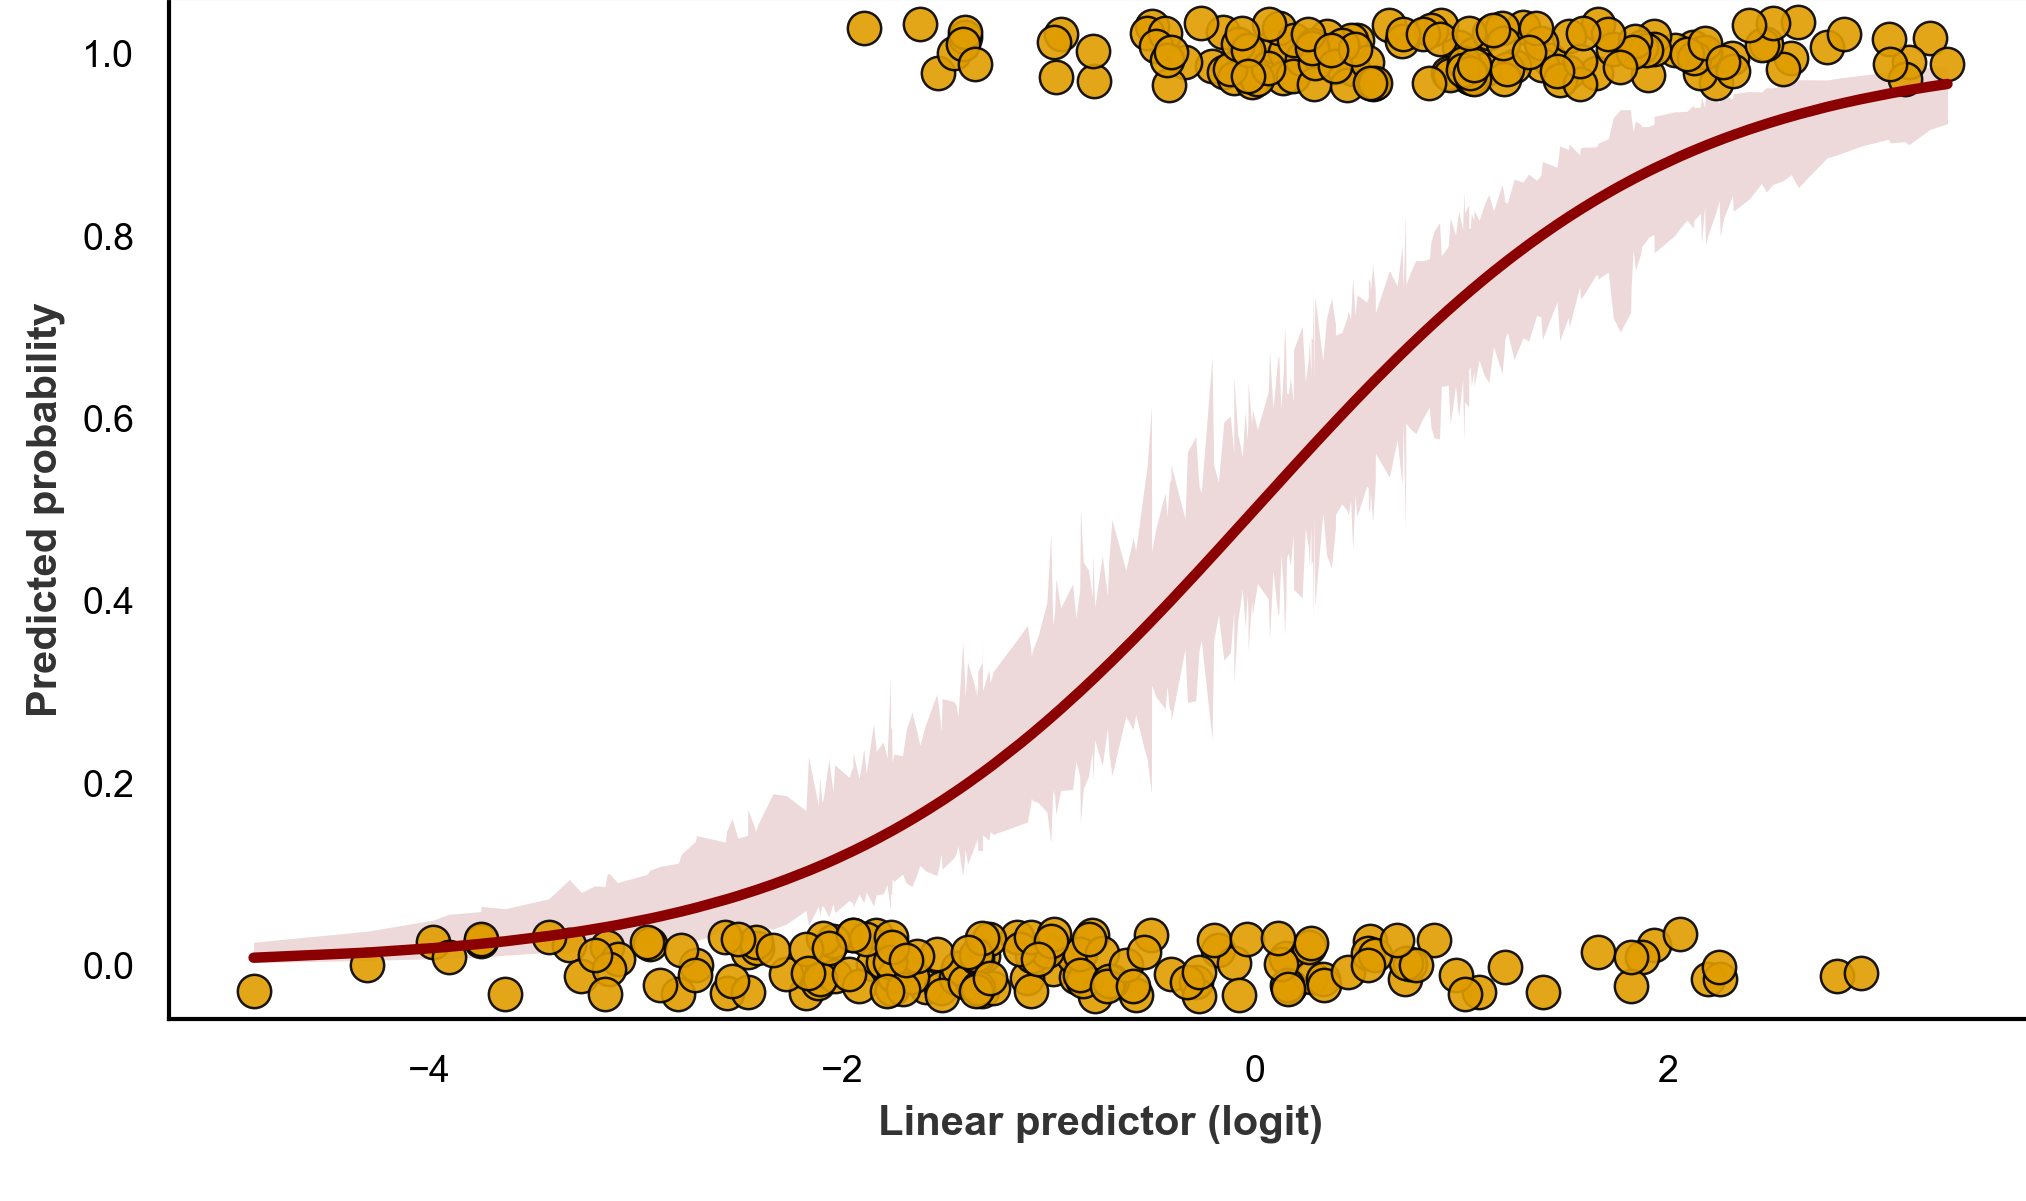
  • Logistic with OR & ROC
  • LOESS, splines, VIF
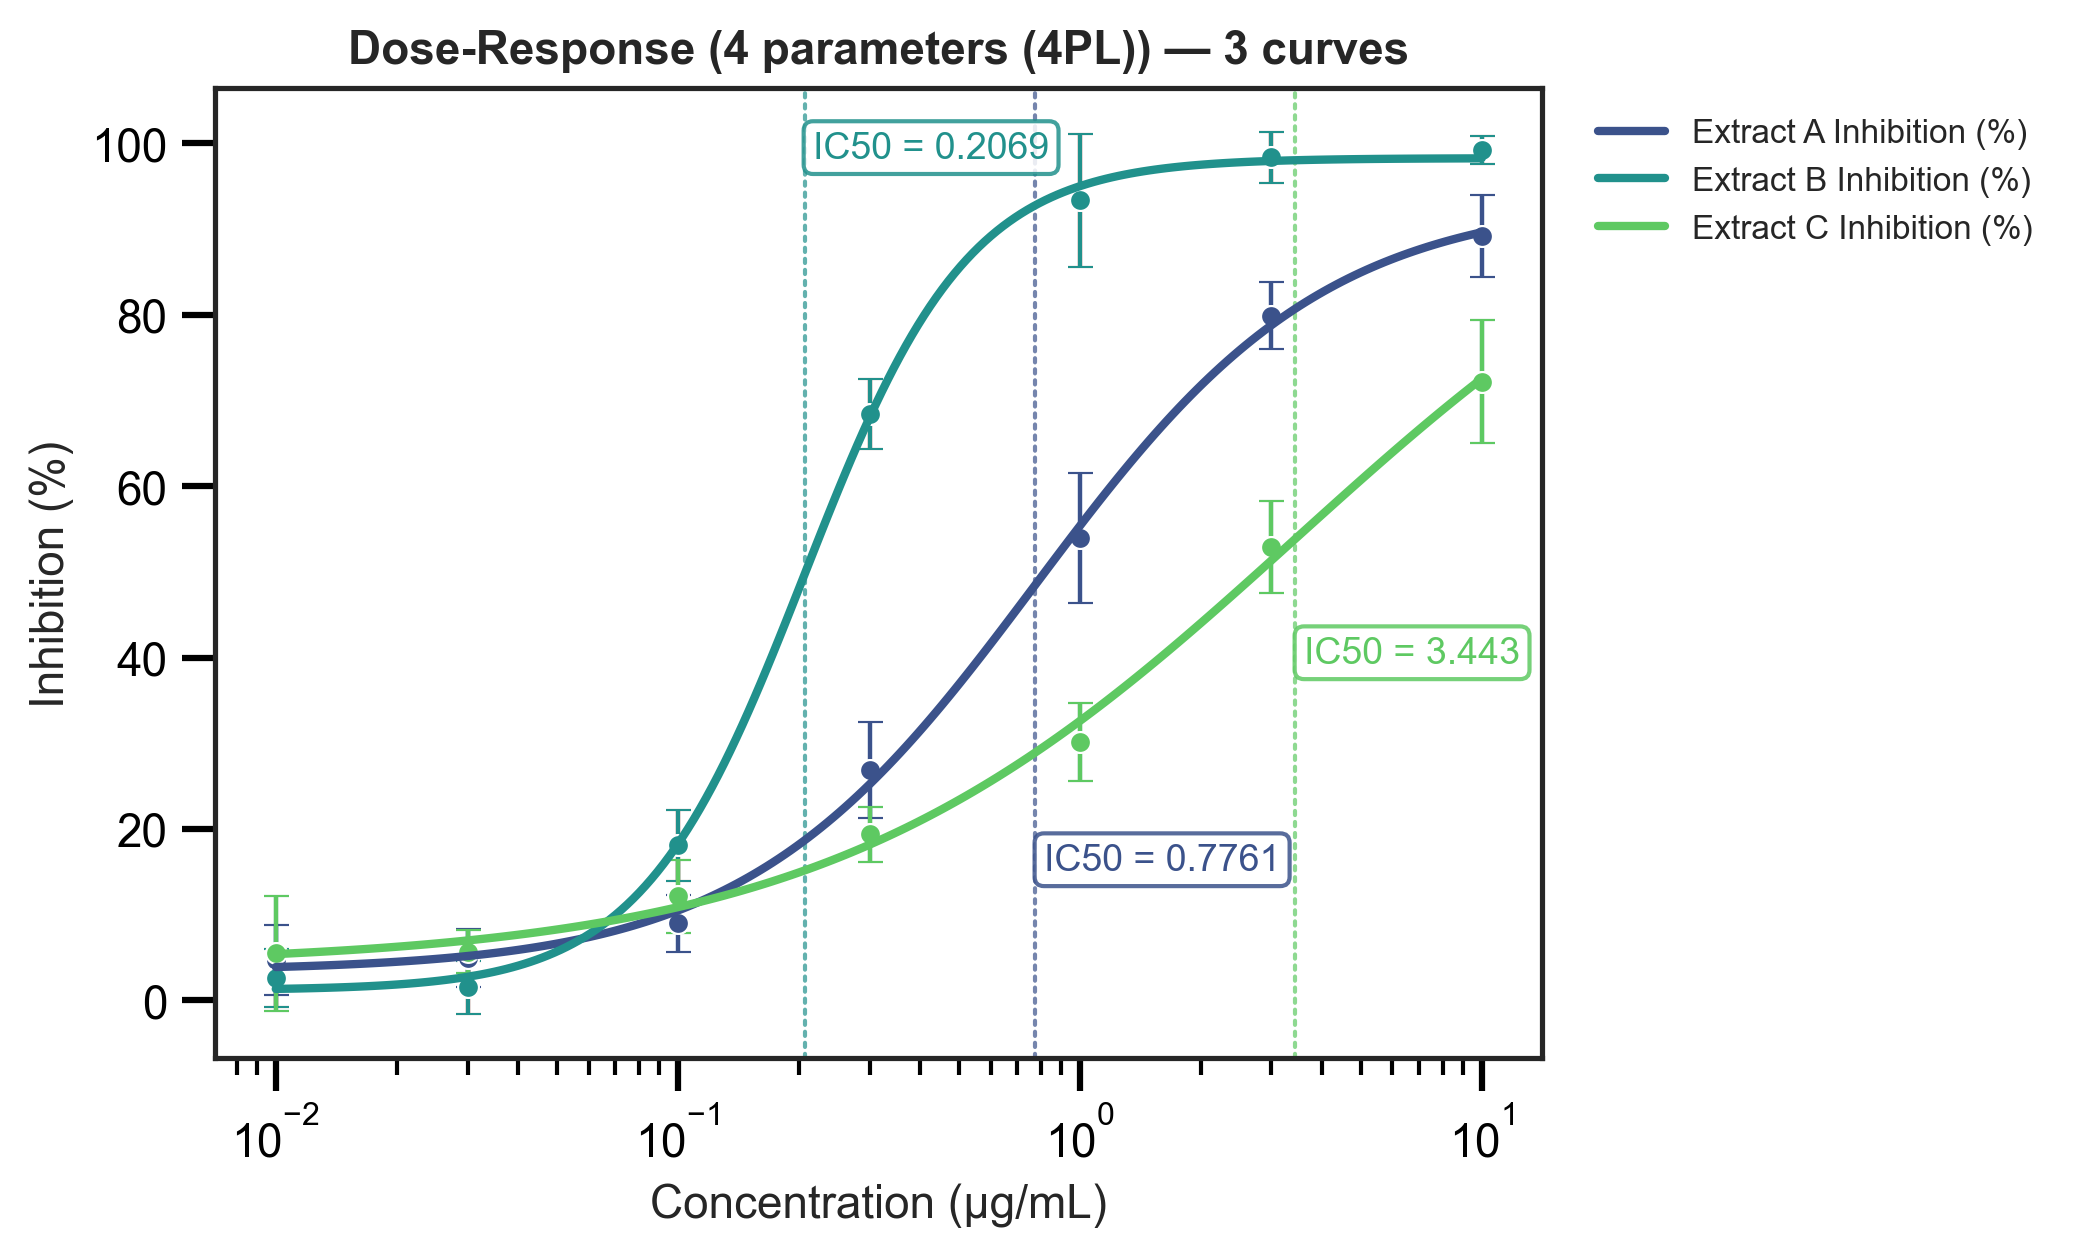
  • Dose-response & area under curve (PK)

Classics

The essentials, refined.

  • Cross-tabulation (χ²)
  • t-tests, ANOVA & post-hoc
  • Descriptives table for your paper

Data preparation

Clean and shape your data before the analysis — all built in, no external tools.

  • Variable dictionary & types
  • Transformations, recoding & missing values
  • Built-in example & synthetic datasets

Equation editor

Write beautiful equations in a WYSIWYG editor with a rich math palette.

  • Live typesetting as you type
  • Calculus, algebra, Greek & more
  • Export PNG, SVG, Word & LibreOffice

Circular graphs

Build complex circular plots with absolute ease.

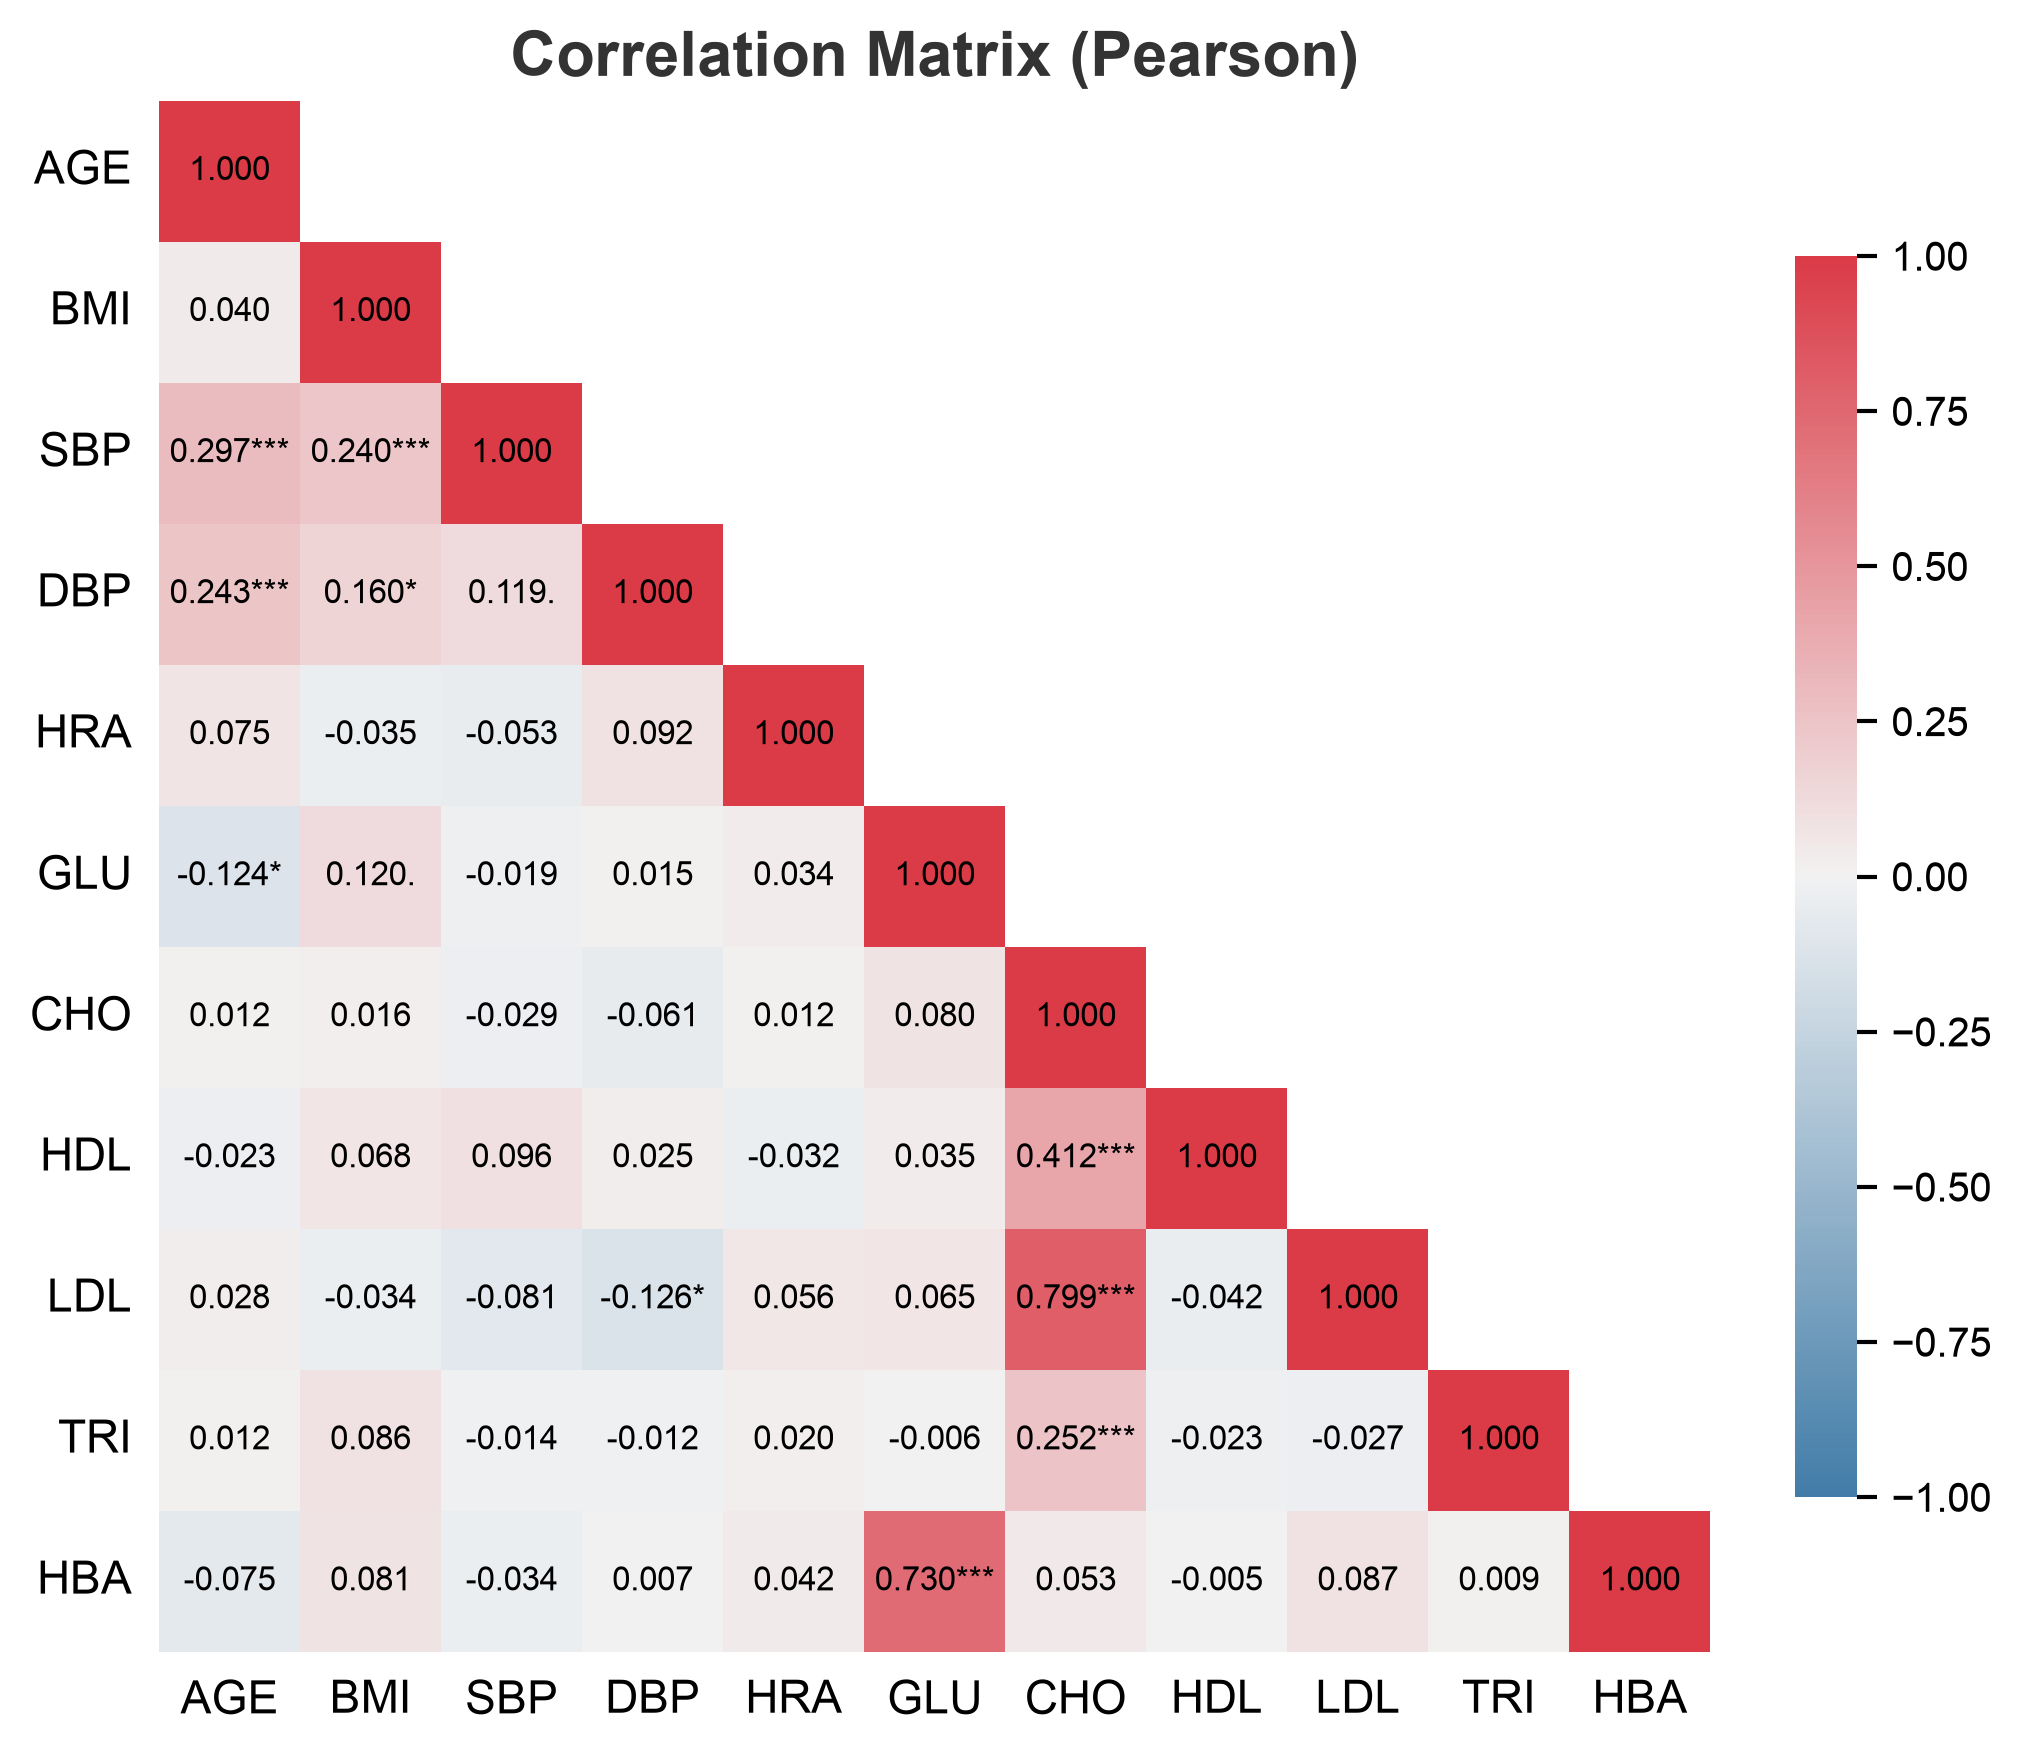
  • Chord & ribbon diagrams
  • Flow & correlation layouts
  • Publication-ready export
The differentiator

An AI data scientist you already know

Plug in your favorite language model via API — OpenAI, Claude or DeepSeek — and operate the software by conversation. The assistant actually runs Magic Stat for you: it creates figures, runs analyses, builds tables, discusses the results and helps with everything.

  • Your model, your key (BYOK) — bring your own API key; nothing is stored or sent anywhere else.
  • Talk to your data — “explore this dataset”, “compare the groups”, “check the assumptions”.
  • It does the work — the agent opens the right window and executes real analyses, figures and tables.
  • It discusses with you — interprets coefficients, folds, p-values and effect sizes in plain language.
  • Never invents results — it only reports what it actually ran, reading the real numbers from your session.
Plug your favorite: OpenAIClaudeDeepSeek
Smart reports

A report ready for your paper

Forget the raw output of conventional software. Magic Stat generates a formatted report — with tables in scientific format and figures — that can be read and commented on by the AI, and exported already formatted.

  • ✔ APA/editorial-style tables, no rework
  • ✔ Statistically formatted output (p, d, η², BF…)
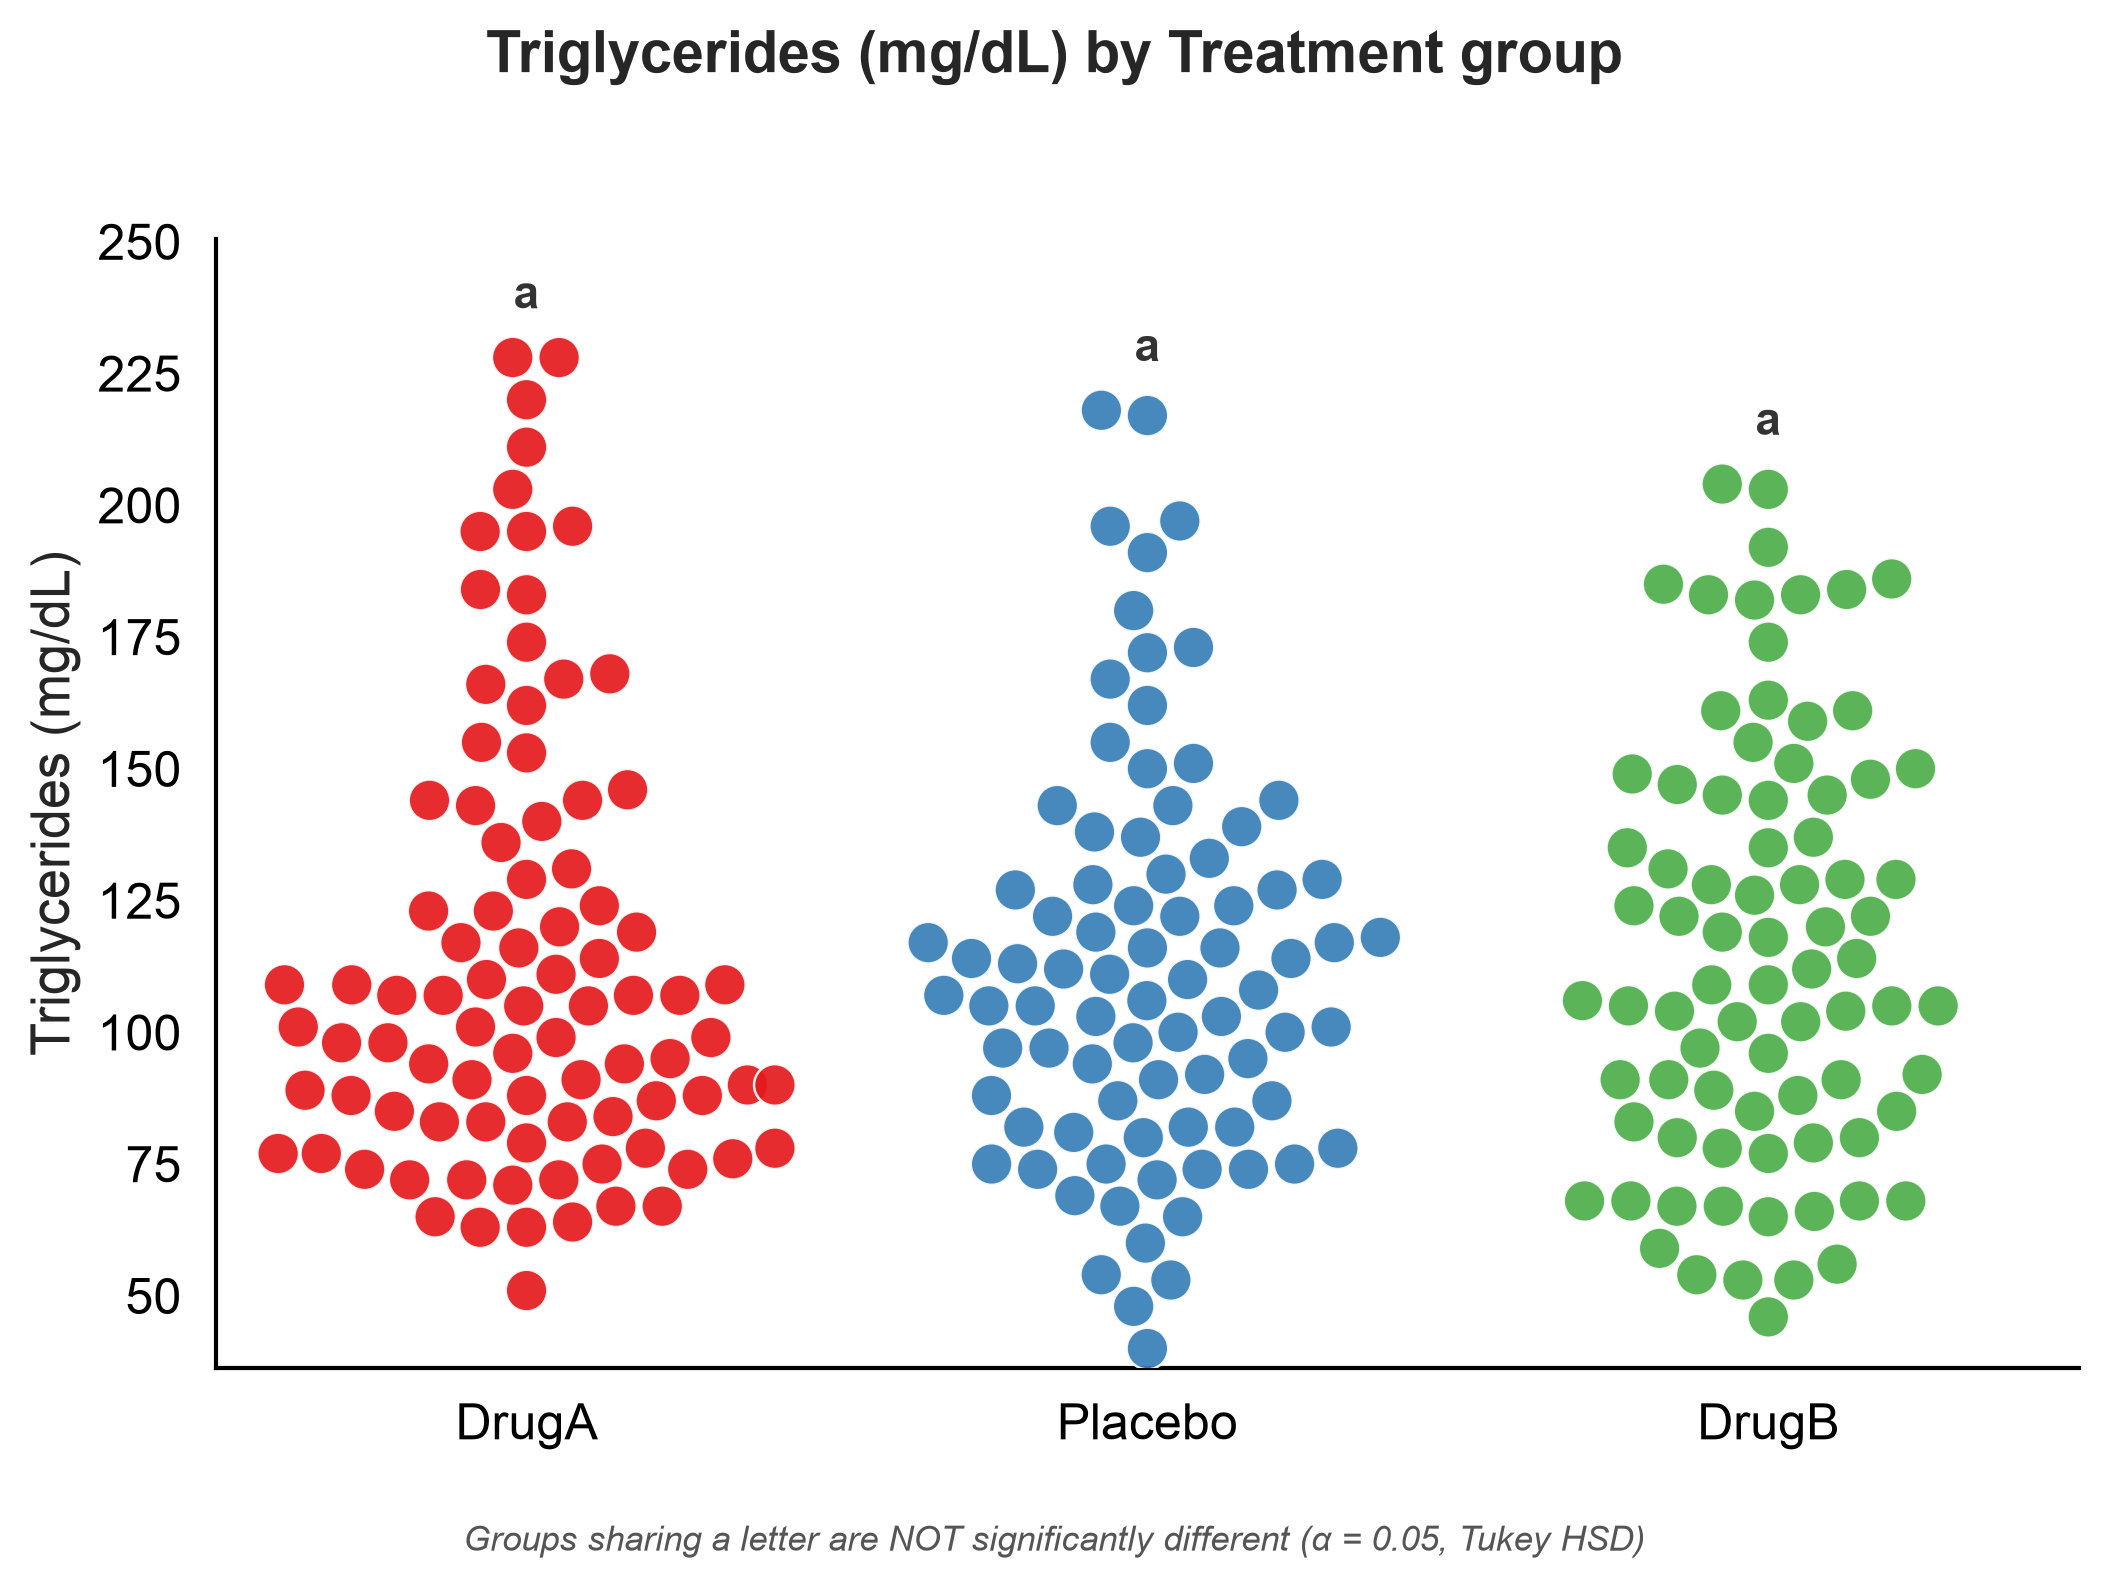
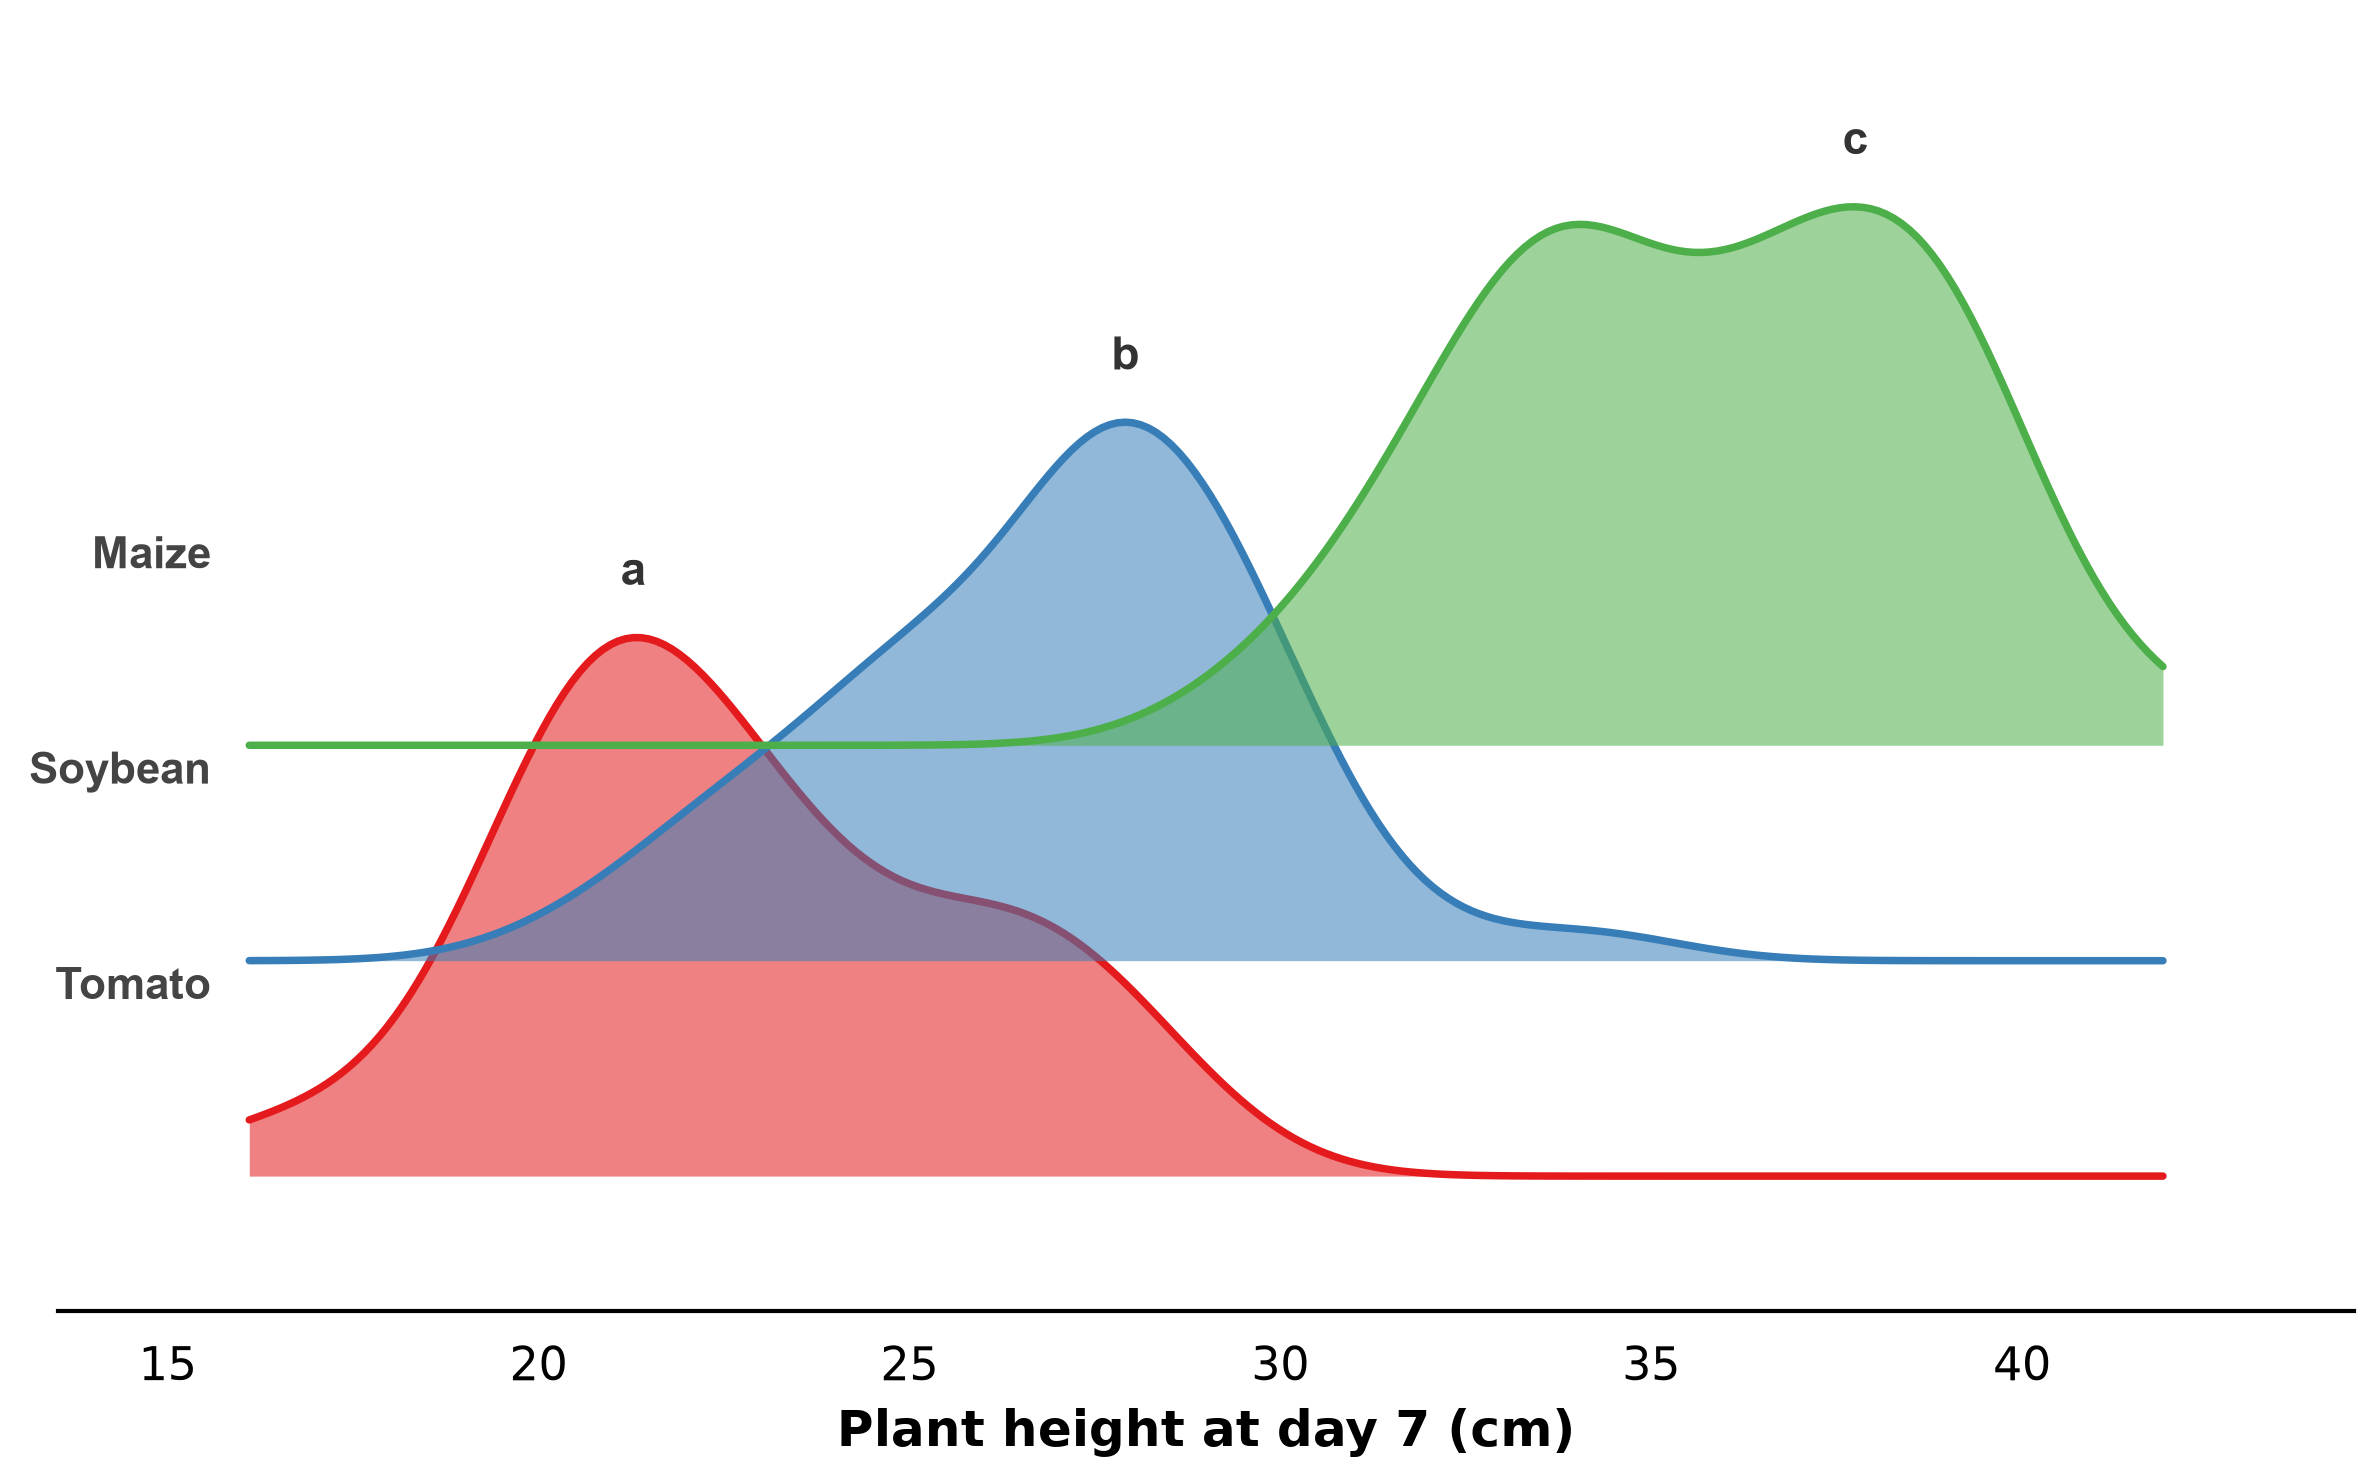
  • ✔ Post-hoc significance letters (Compact Letter Display — a, b, c)
  • ✔ AI comments on every section — integrated review
  • ✔ Export formatted and keep the session for review
table ANOVA + post-hocF(4, 495) = 21.3, p < 0.001, η² = 0.147
Post-hoc (Tukey) Group D: a  Group E: a  Group A: b  Group B: bc  Group C: c
link Correlationr(498) = 0.978, 95% CI [0.973, 0.982], p < 0.001
trend Regressionβ = 6.78, SE = 0.13, p < 0.001, R² = 0.956
sparkles "Groups sharing a letter are not significantly different — the report adds the letters automatically."
Data quality

Detect outliers fast.

Find suspicious values using standard methods — then remove them automatically, from one variable or the whole sample.

IQRZ-scoreModified Z (MAD)Grubbs' test

Flagged values are highlighted in the data grid and box plot — inspect, then exclude with one click.

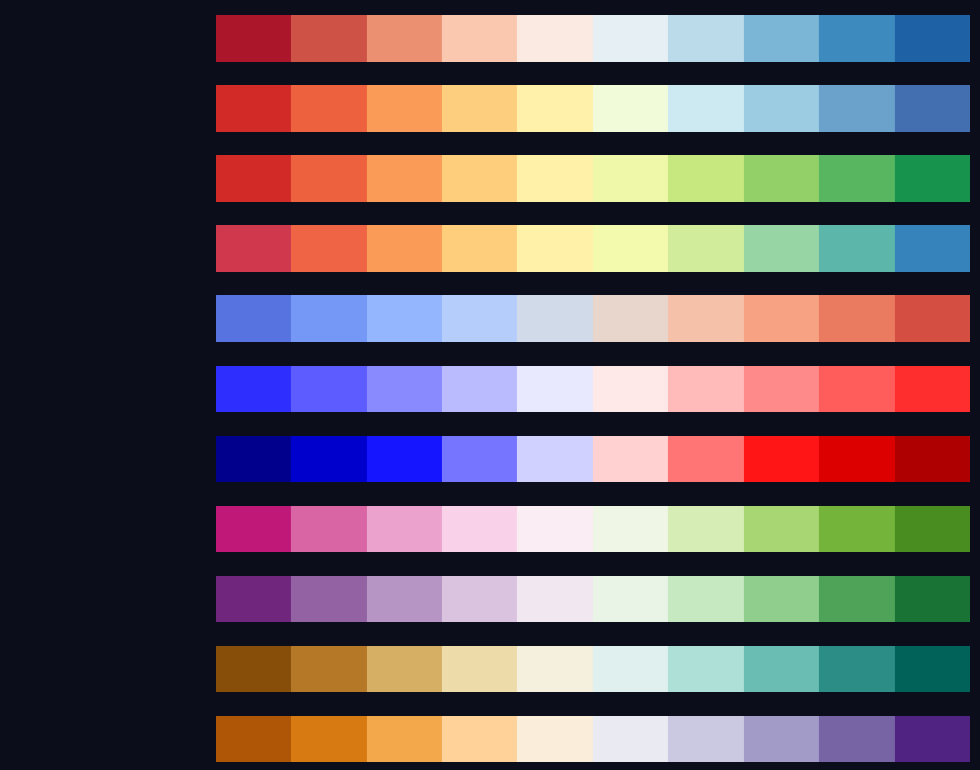
Color palettes

Color palettes designed for scientists.

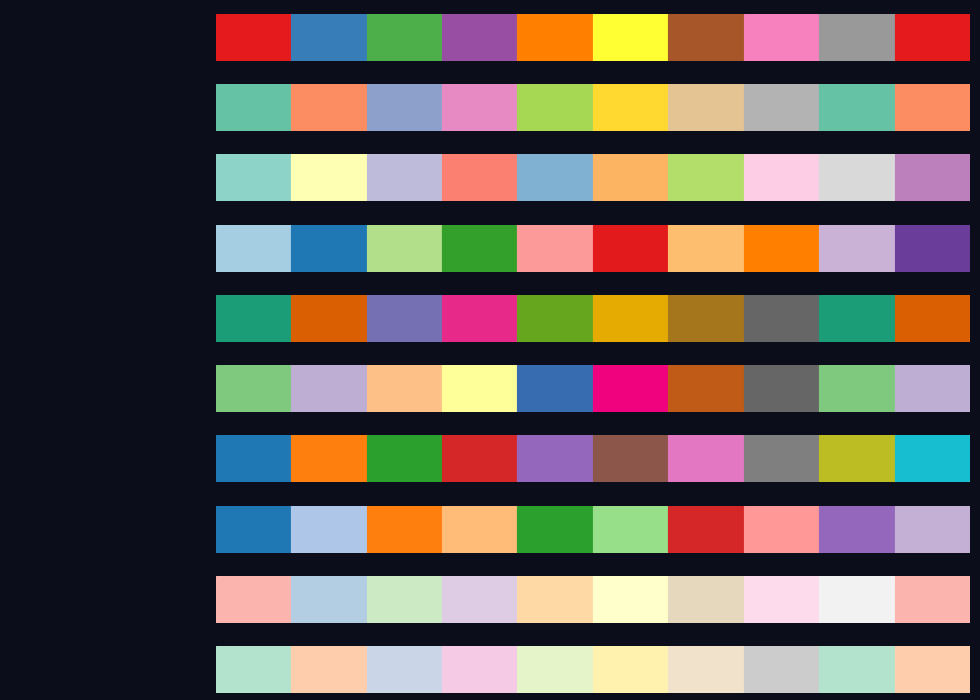
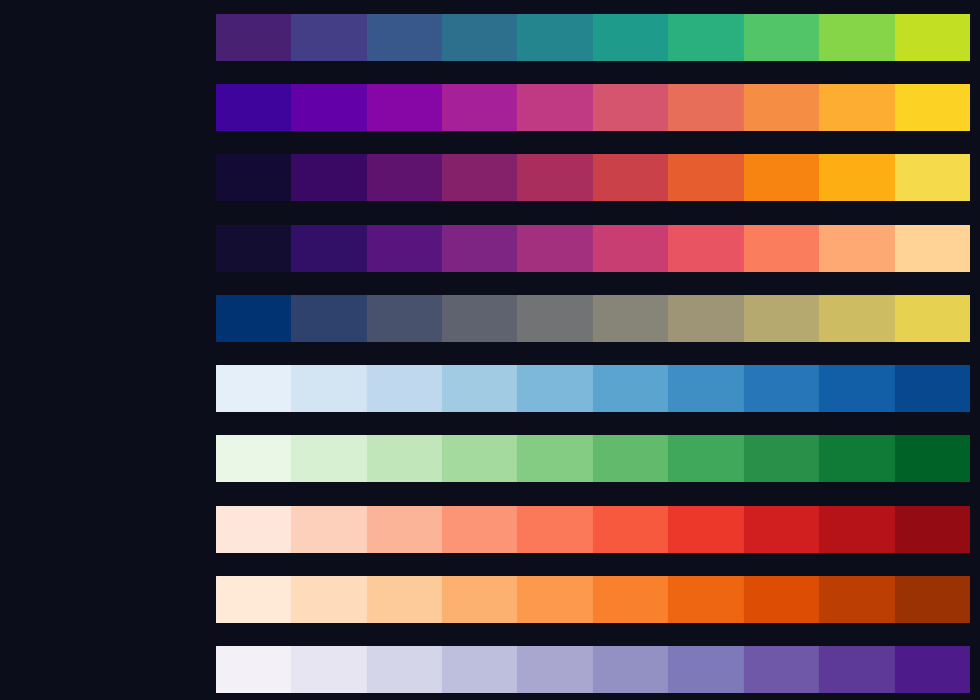
Choose from a curated catalog of perceptually uniform and colorblind-safe palettes — so your figures stay beautiful and publication-ready, not washed out or clashing.

Qualitative

Perfect for categories and groups — distinct, harmonious colors that pop.

Qualitative palettes

Sequential

Great for continuous data and gradients, perceptually uniform by design.

Sequential palettes

Diverging

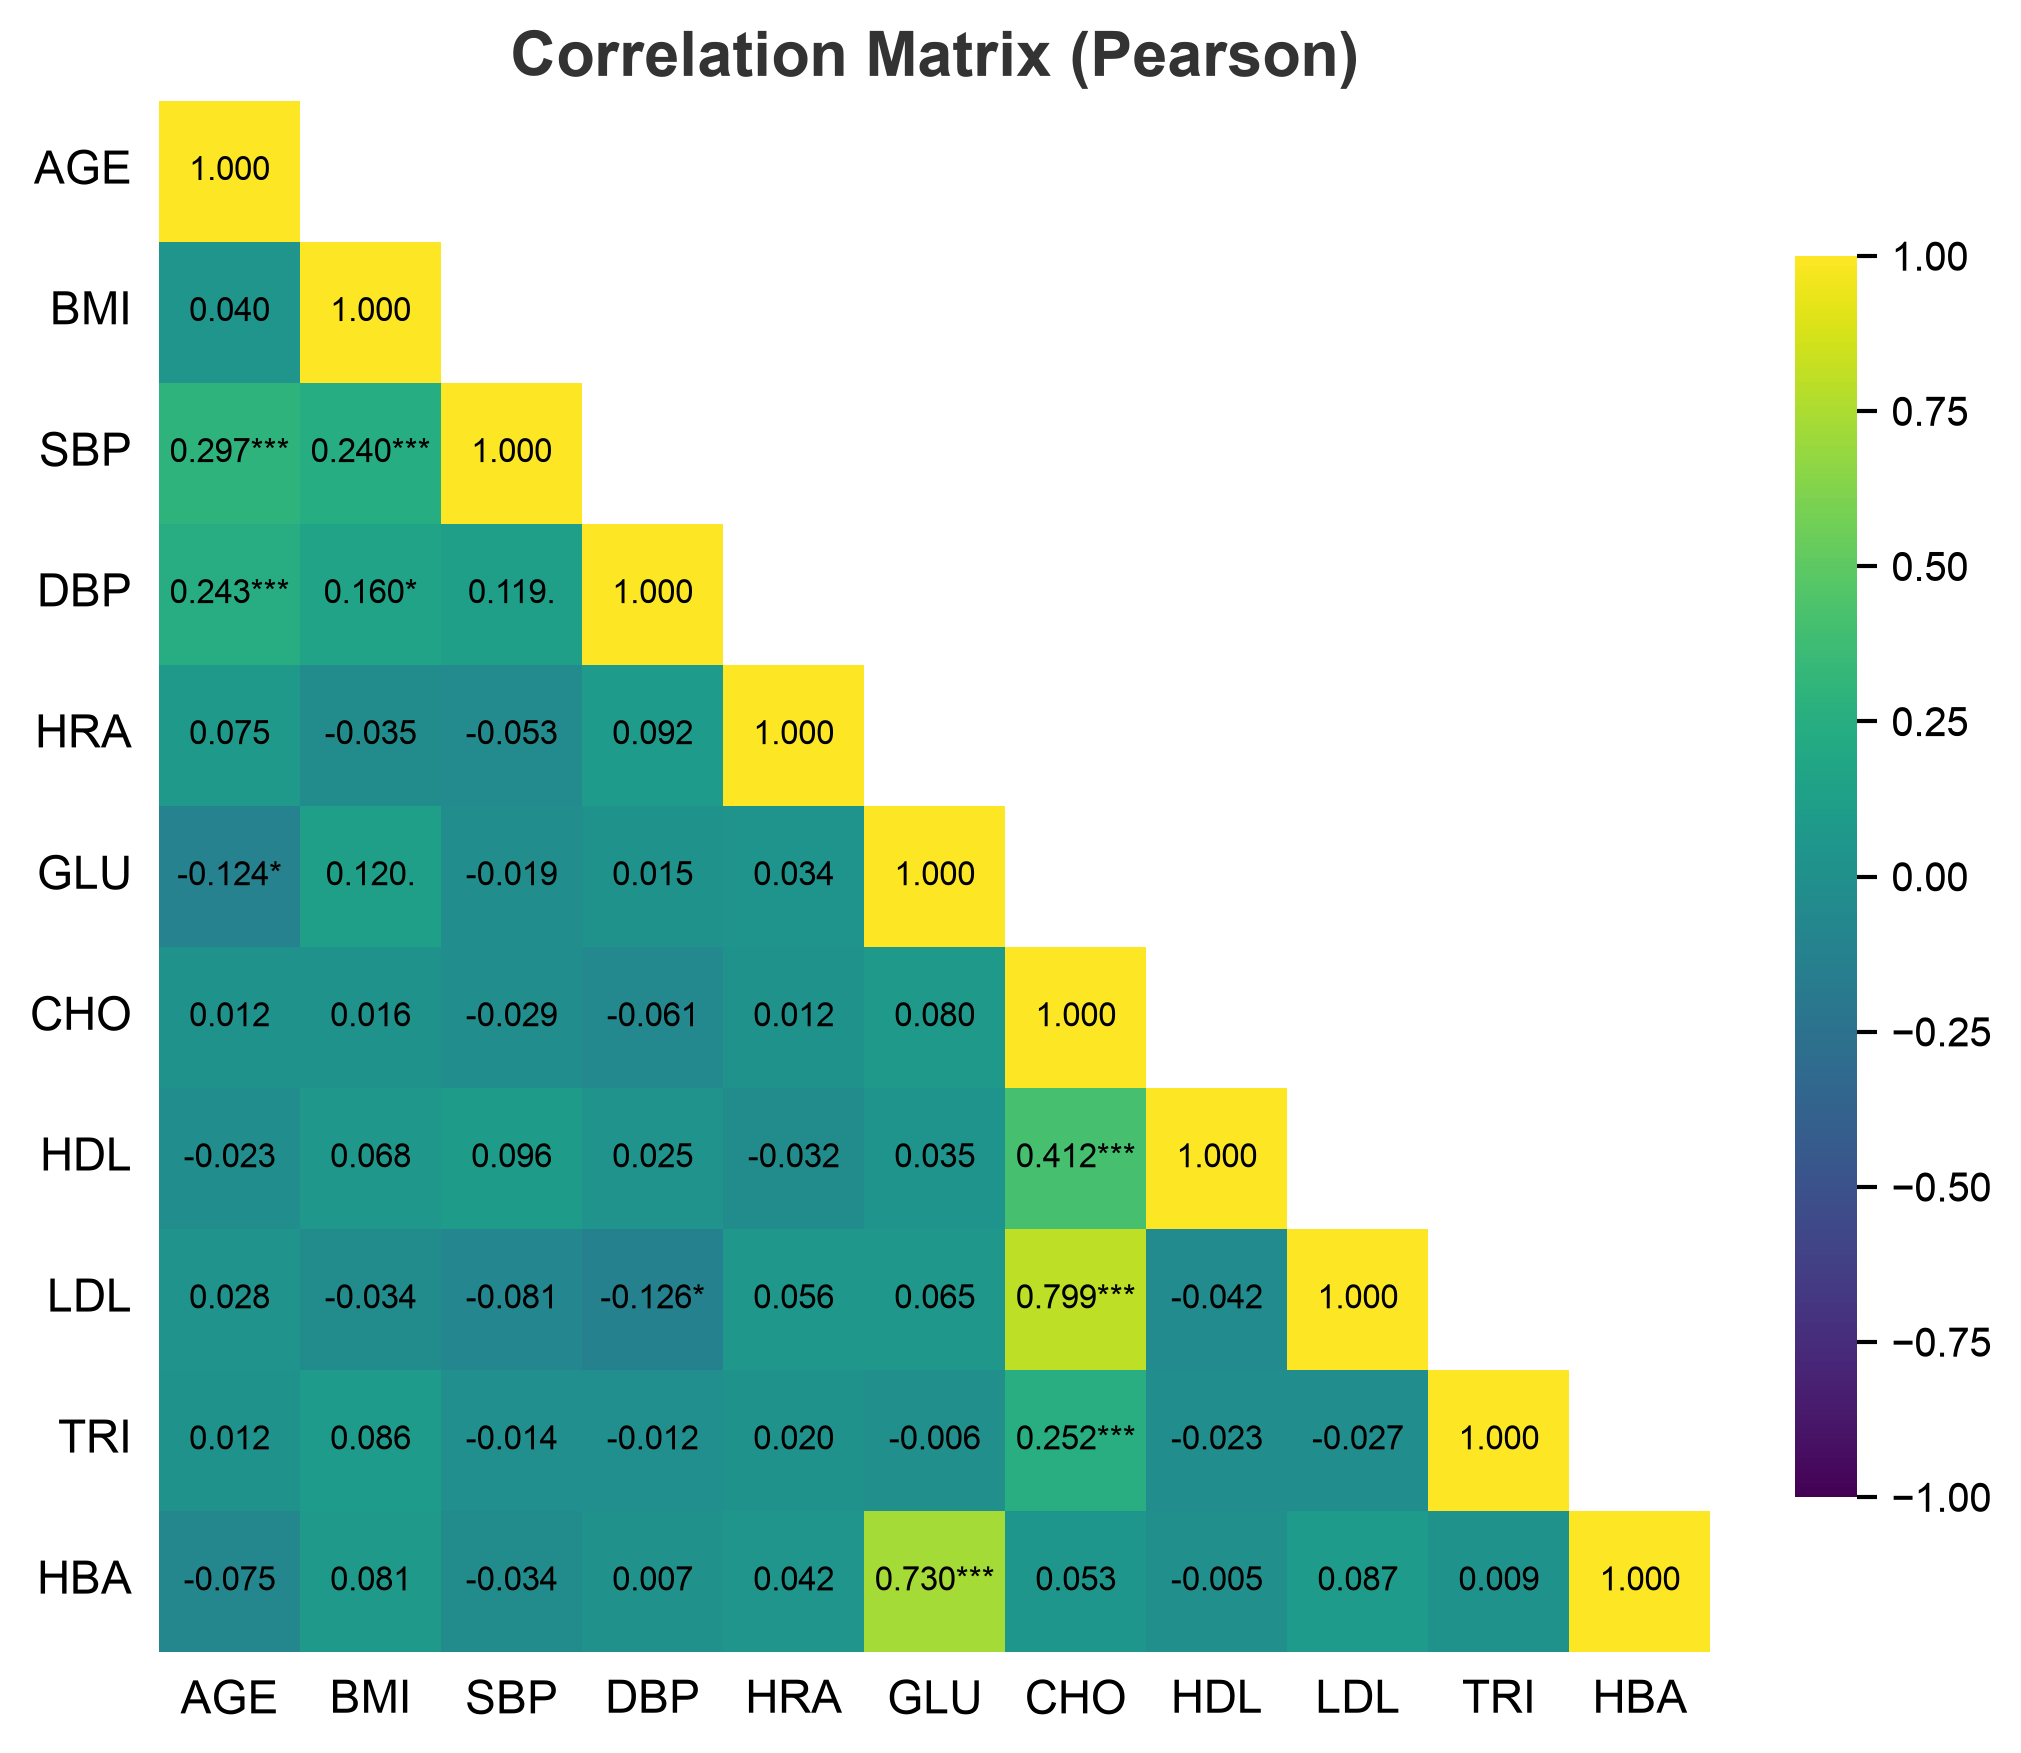
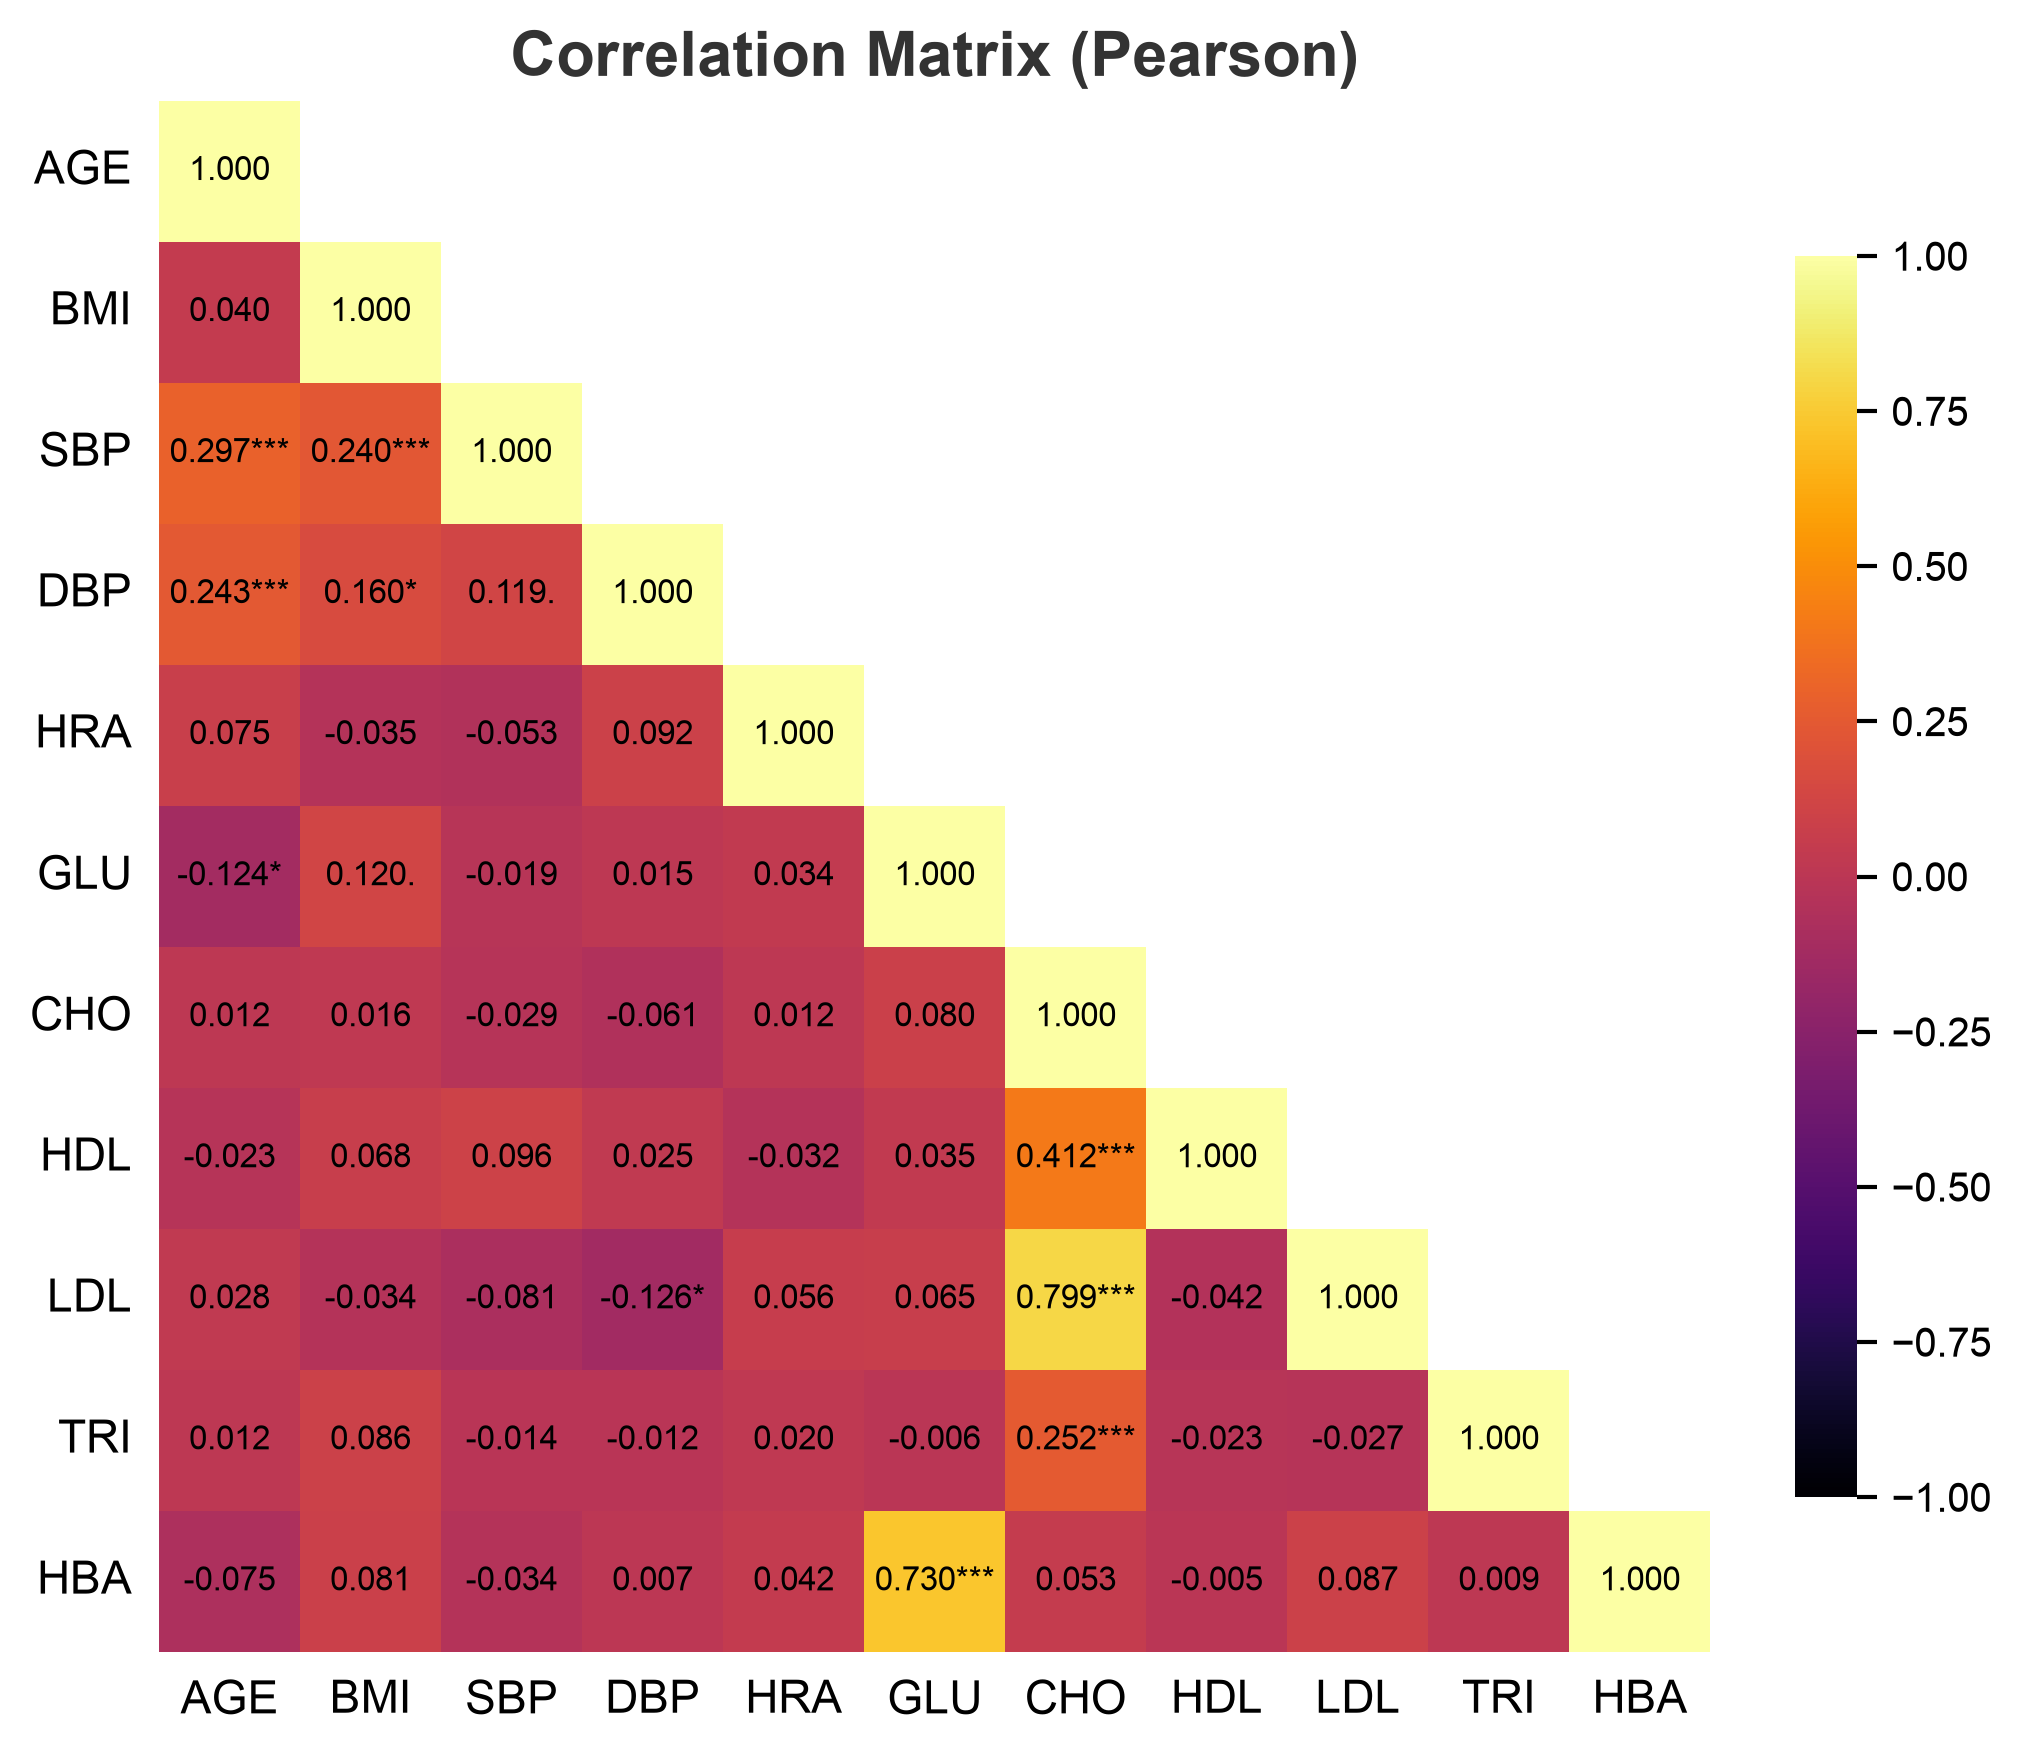
Ideal for correlations and centered data — highlights direction and magnitude.

Diverging palettes

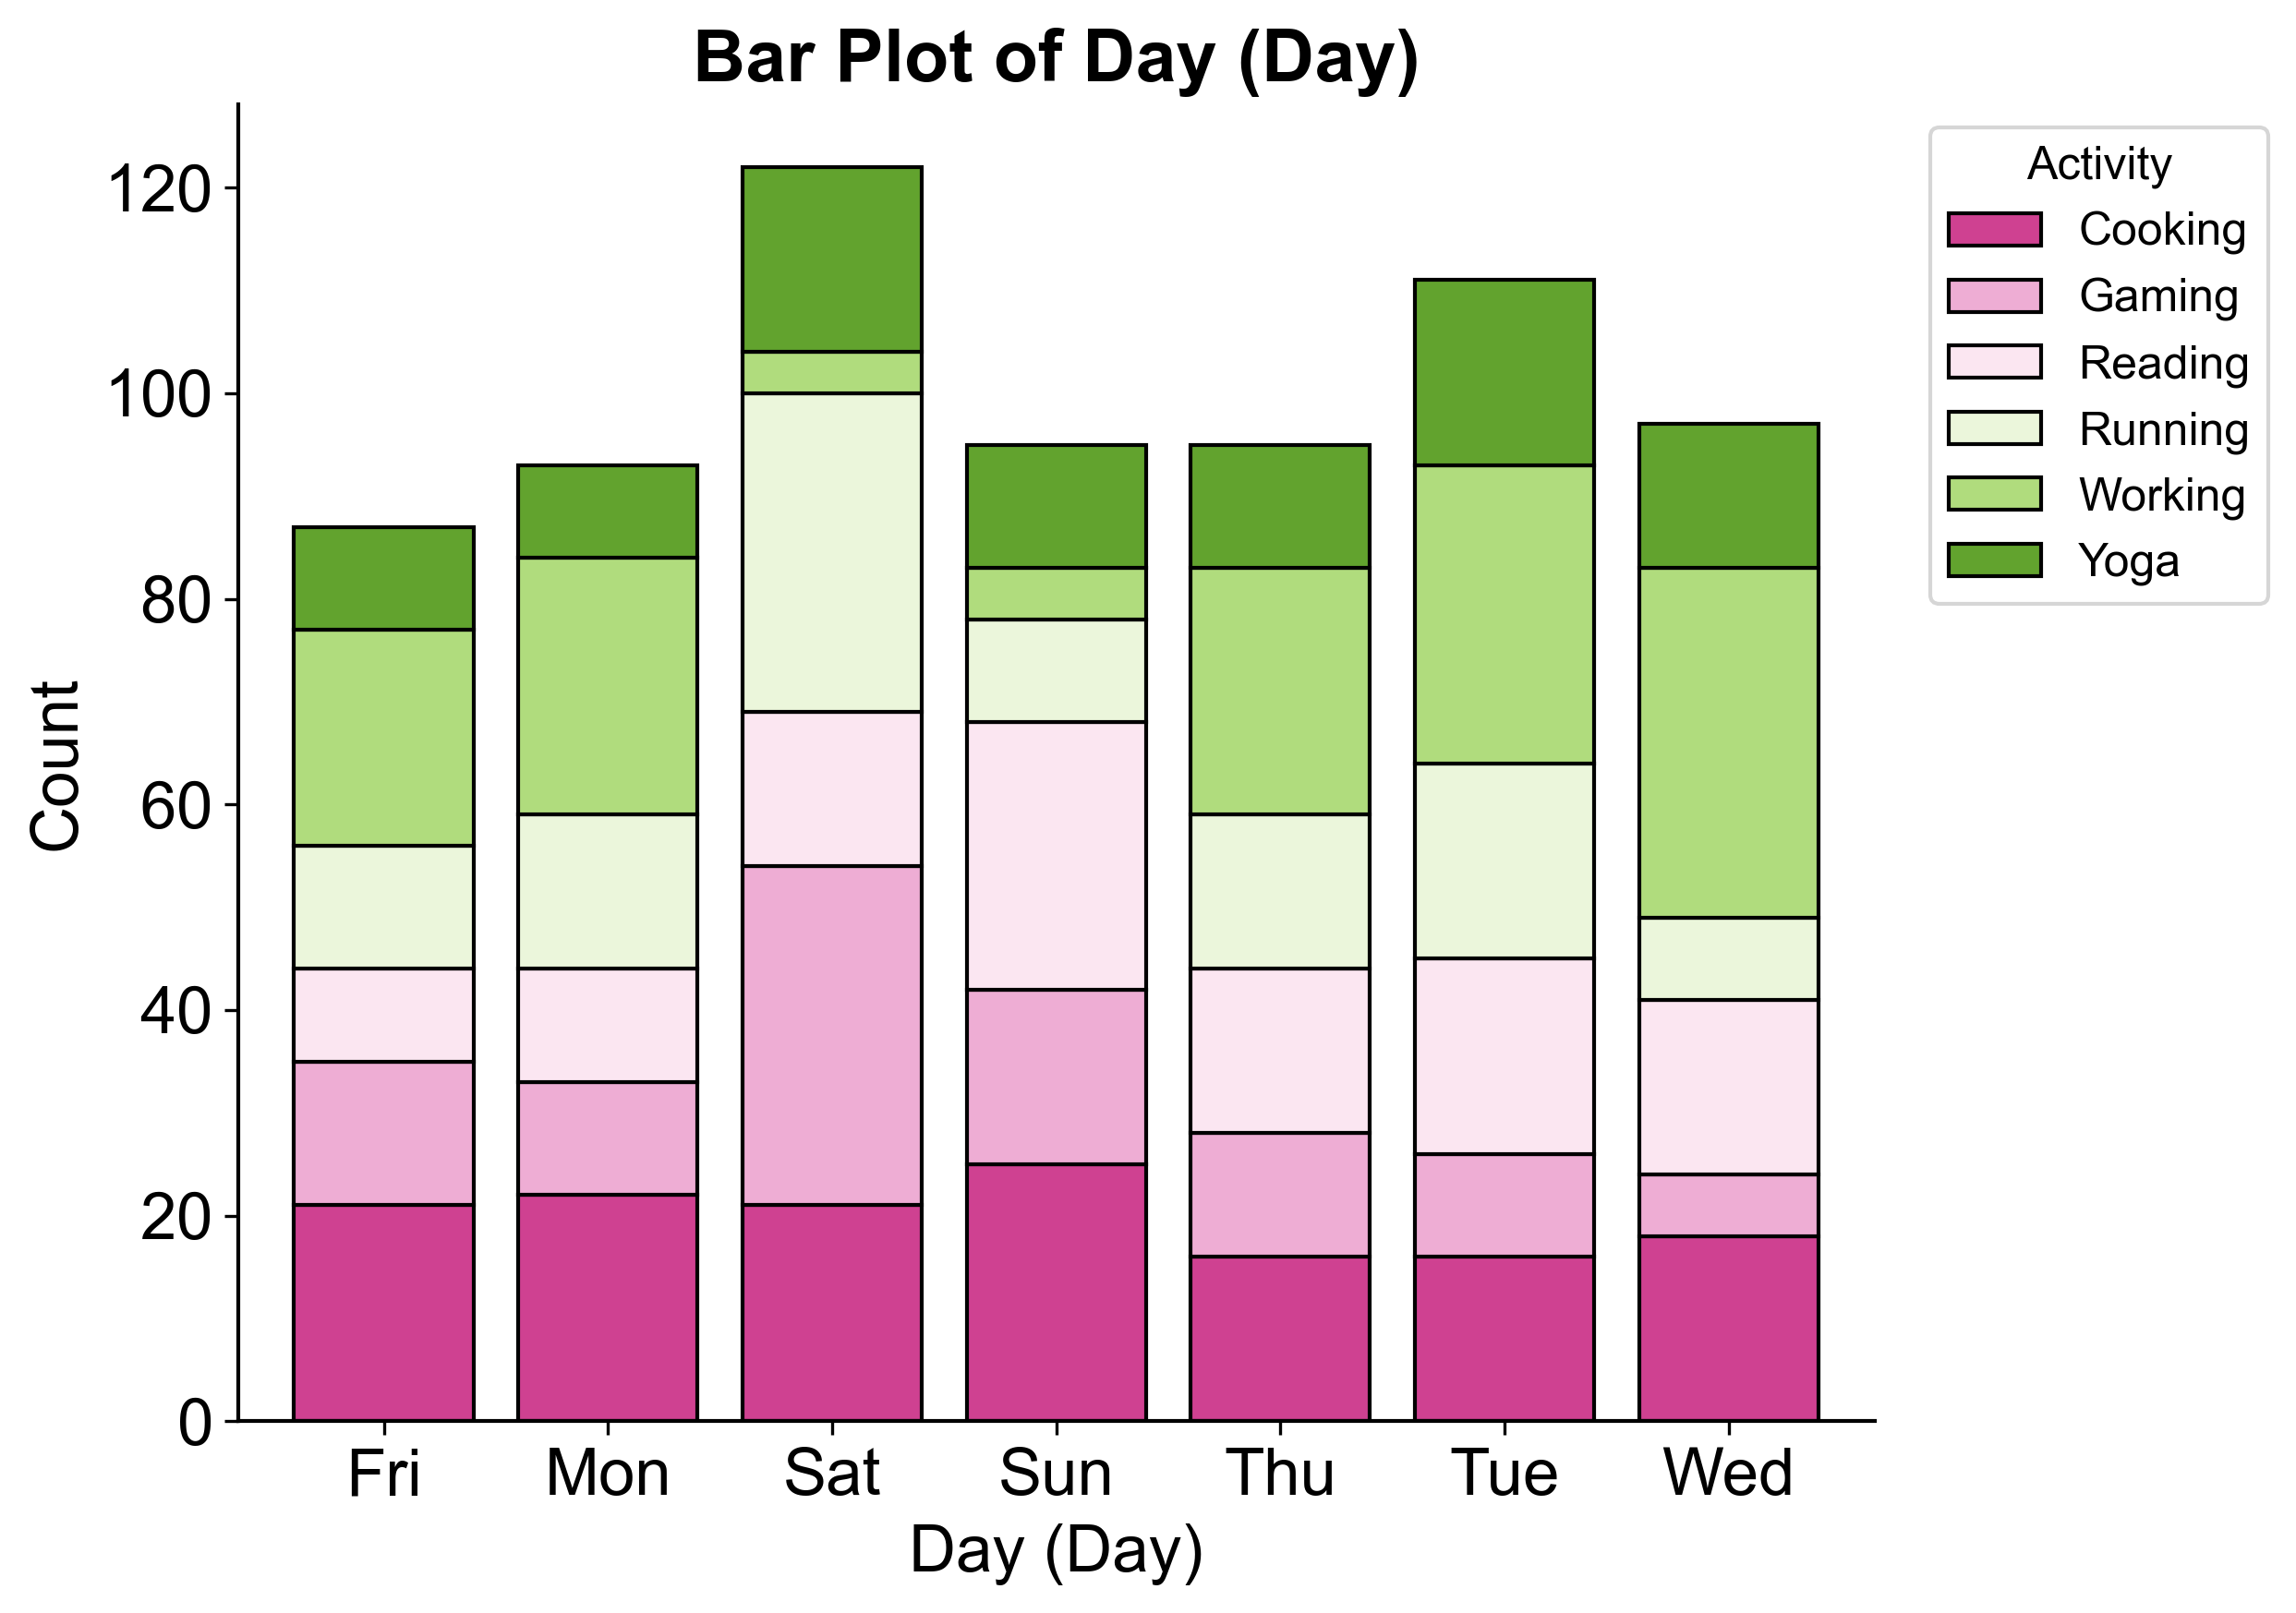
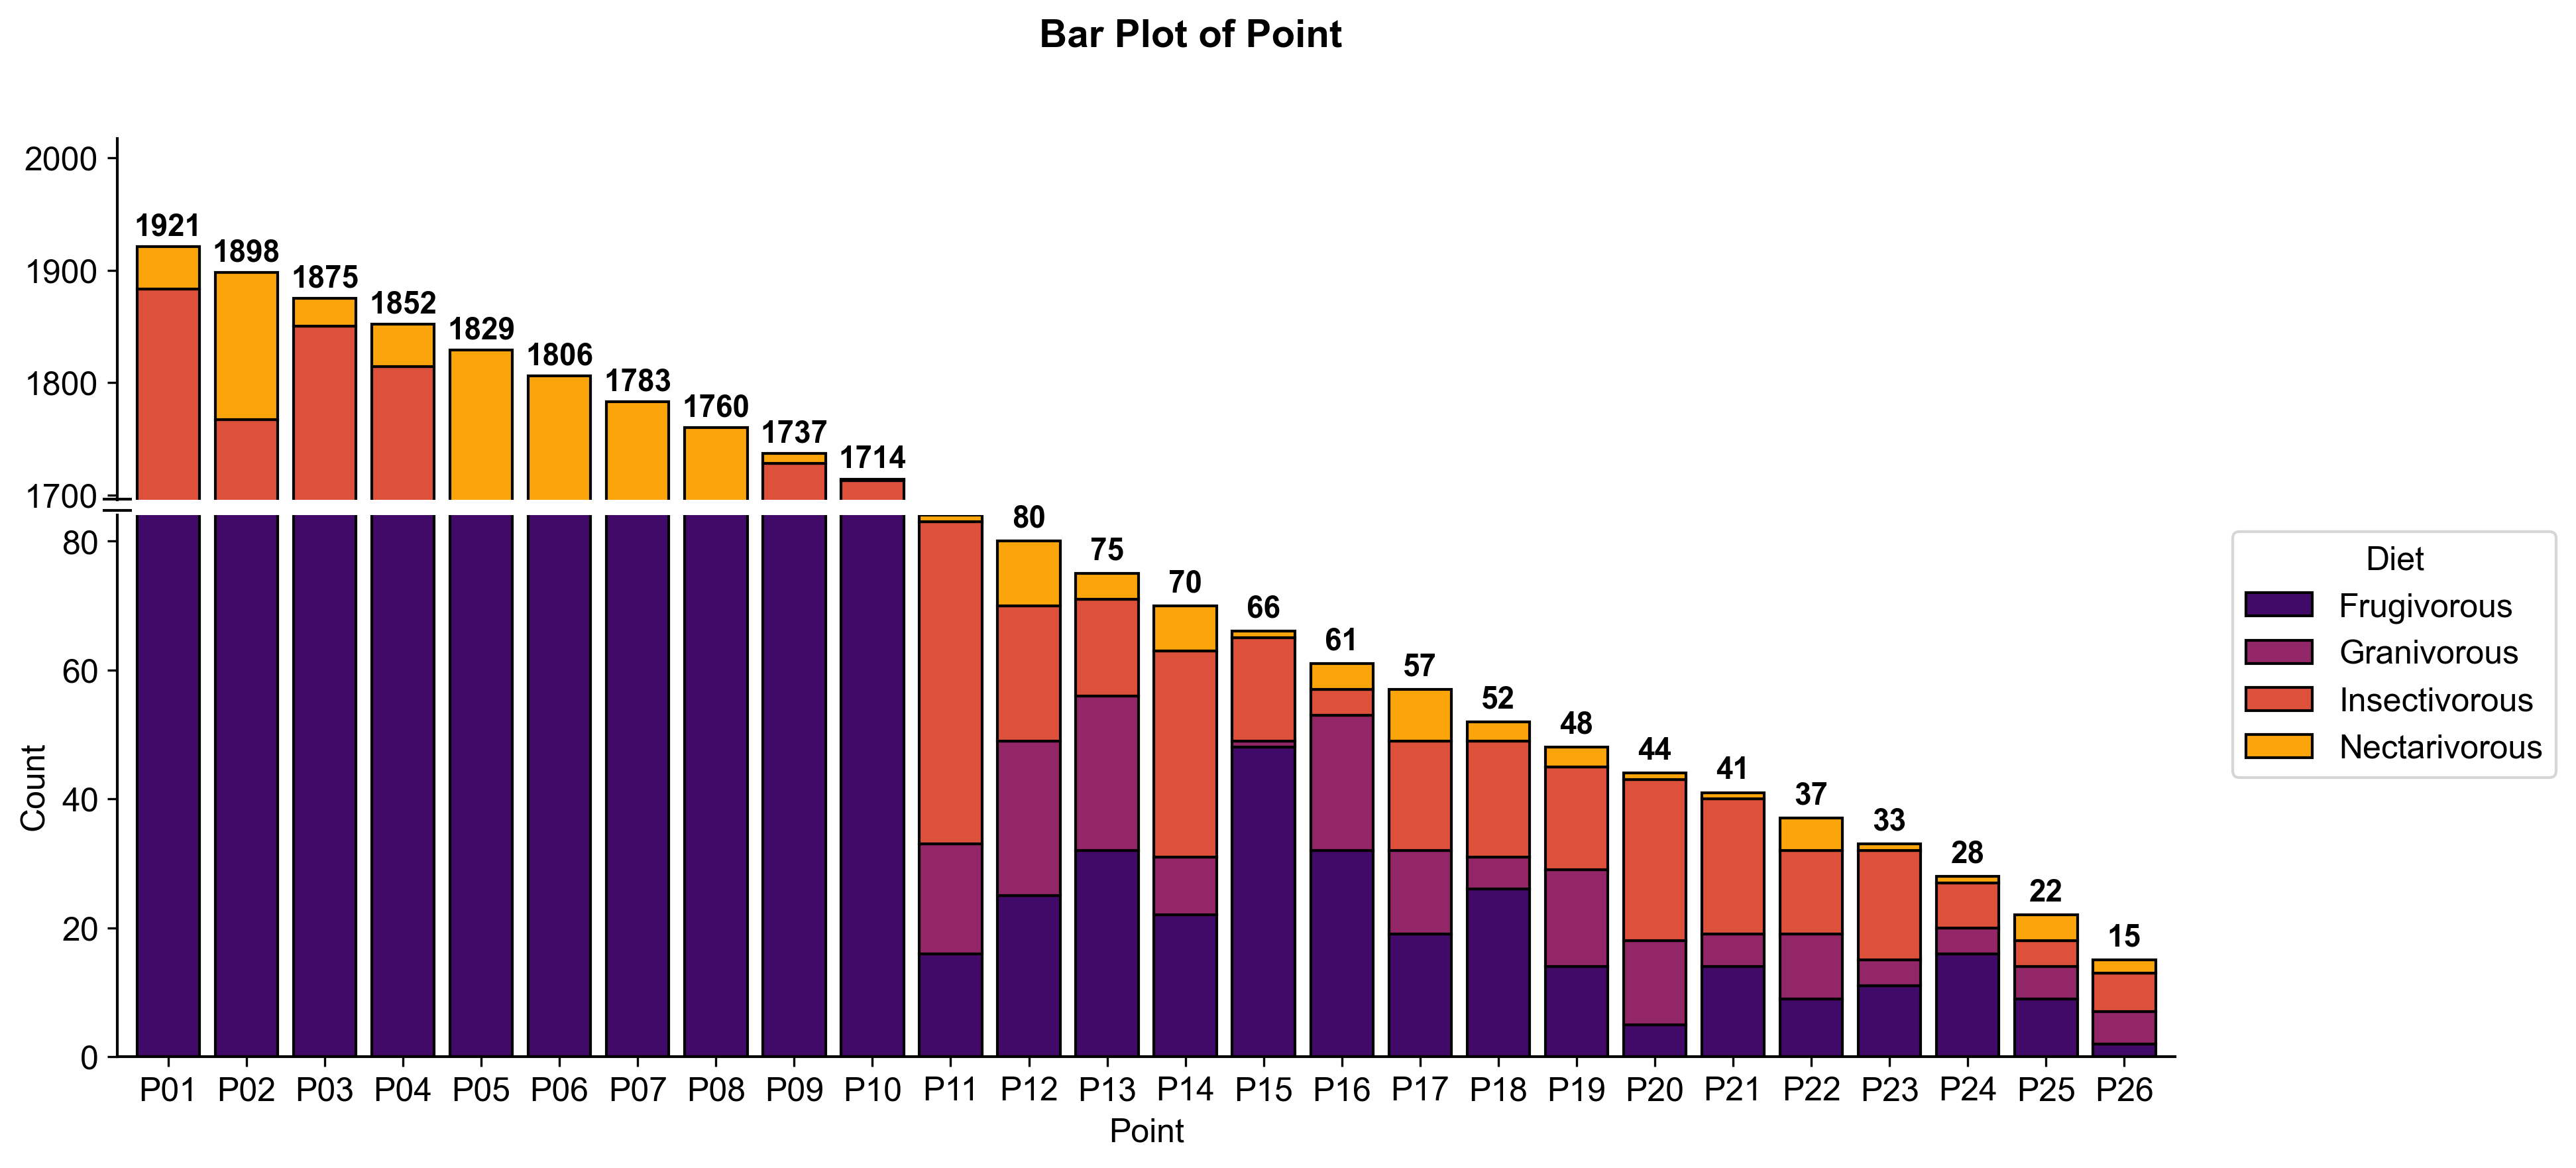
One palette selector across every figure — box plots, dot plots, scatter, bars, error plots, and more — with live color previews.

Questions

Frequently asked questions

No. Magic Stat is a window-based application, with menus and an integrated spreadsheet. You open the file, click the analysis and get a figure + table + formatted report.

Yes. Magic Stat runs on both Intel and Apple Silicon Macs. On Apple Silicon, macOS may ask to install Rosetta the first time you open the app — it's a one-click Apple feature that runs Intel apps smoothly, and you only do it once.

Yes — Windows 10/11, 64-bit, with the same full feature set as the macOS and Linux builds.

Yes. Magic Stat runs on Windows 10/11 and on 64-bit Linux, shipped as a self-contained AppImage — download it, mark it executable and run: no installation and no dependencies to chase. All three platforms (macOS, Windows and Linux) carry the same full feature set.

Yes. You get a 7-day free trial with full access to every feature — no credit card required. After the trial, activate the app with a license purchased on Gumroad.

The AI uses your own key (BYOK) with OpenAI, Claude or DeepSeek. The app itself works offline; the assistant needs a connection.

Excel (.xlsx/.xls), CSV and ODS (LibreOffice). You can also paste data straight into the spreadsheet.

Yes. Tables are born in scientific/APA format, and the report can be exported formatted — no copying raw output.

Pricing

One license, annual access.

US$ 990 per year. No subscriptions, no surprises.

gift 7-day free trial — full access to every feature, totally free, no card required.

calendar Annual license

Annual License

Every feature of Magic Stat on macOS, Windows and Linux — for one full year.

$ 990 USD / year

One payment per year · no hidden fees

  • Full access to every analysis & feature on macOS, Windows & Linux
  • AI assistant included (bring your own key)
  • APA-ready figures, tables & reports
  • All updates included with your subscription
  • Activation on 2 devices
Buy now — activate for 1 year
lock Secure checkout by Gumroad instant Instant delivery